

Quick Note: Gold, silver, and Bitcoin are very different assets. Gold is a monetary metal, silver mixes money and industry, and Bitcoin is a volatile crypto that many call digital gold. All three react to geopolitics, money policy, and sometimes industry cycles. Their price patterns change through the year, and looking at history can give clues about the best months to hold each.
Gold Seasonal Trends (2004‑2026)
We use the SPDR Gold Shares ETF (GLD) as a stand‑in for spot gold. The 22‑year window smooths out the big buying rush by central banks after 2020, giving a clearer long‑term rhythm.
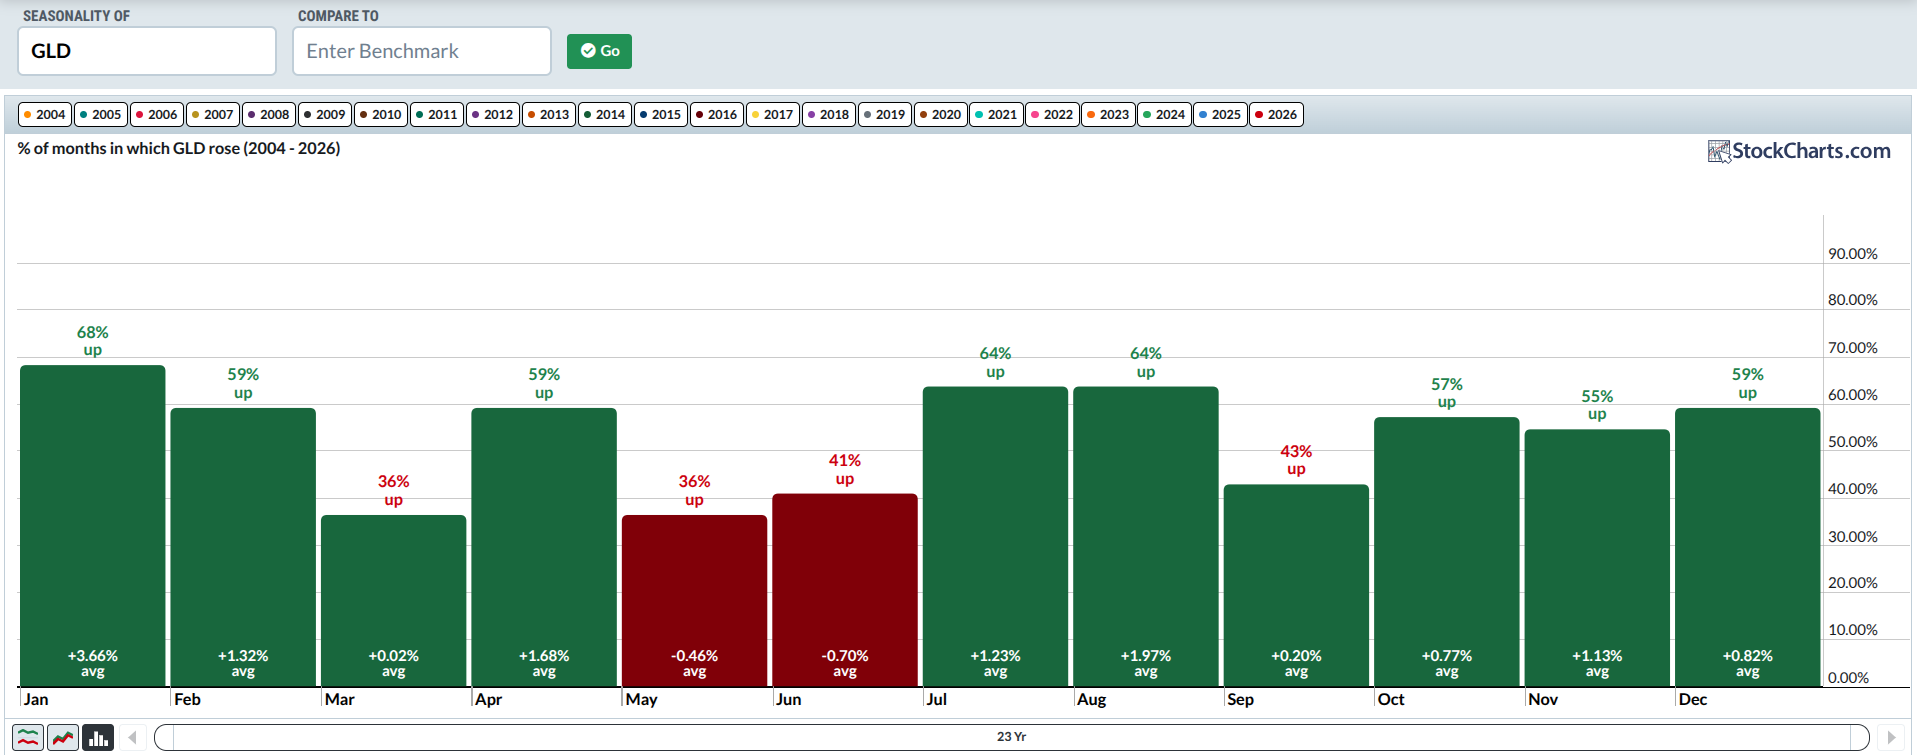
January is the strongest month for gold. It shows up‑days 68% of the time and averages a 3.66% gain. July and August rank second for up‑days (64%). August also gives about a 2% average return, while July’s return is a bit lower.
Insider Tip #1: A long‑term view smooths recent spikes. Use a shorter window if you want those recent trends to show up.
How does gold compare to the S&P 500? We look at GLD versus the SPDR S&P 500 ETF (SPY). Holding both, January beats the market by about 3.42% on average, and August adds roughly 1.57% extra. More up‑days don’t always mean bigger gains, so watch both numbers.
Silver Seasonal Trends (2006‑2026)
For silver we use the iShares Silver Trust (SLV). The chart covers 20 years.
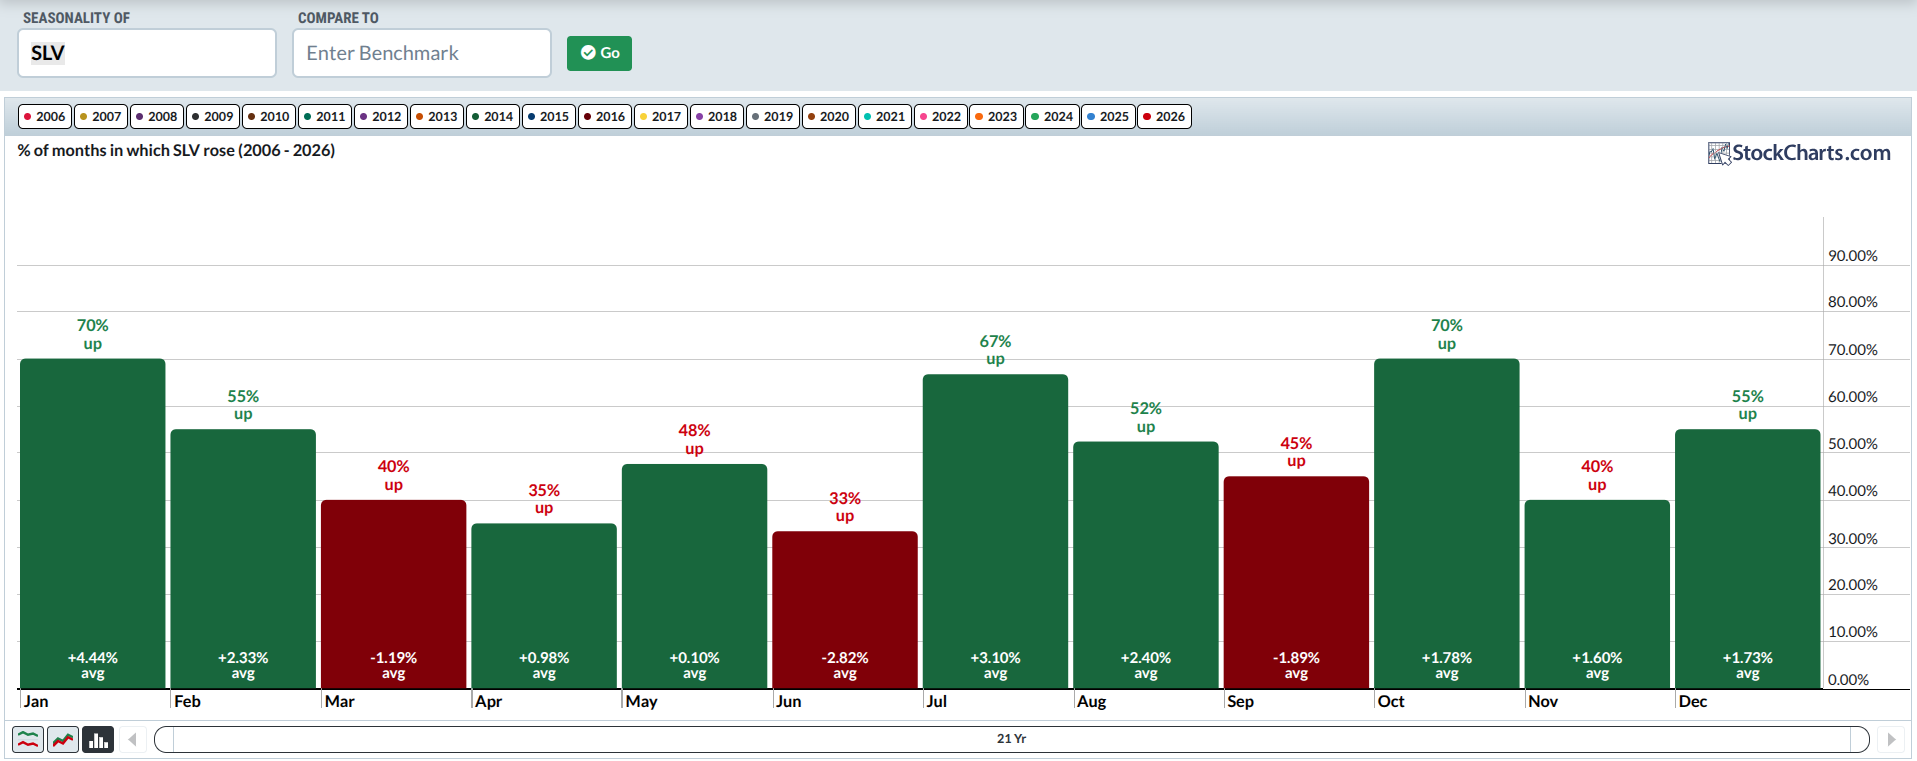
January and July are the best months. January closes up 70% of the time with a 4.44% average gain. July is up 67% of the time and averages 3.10% gain. February and August give over 2% average returns, but their up‑day rates are close to 50%, so you’ll need tighter trade management.
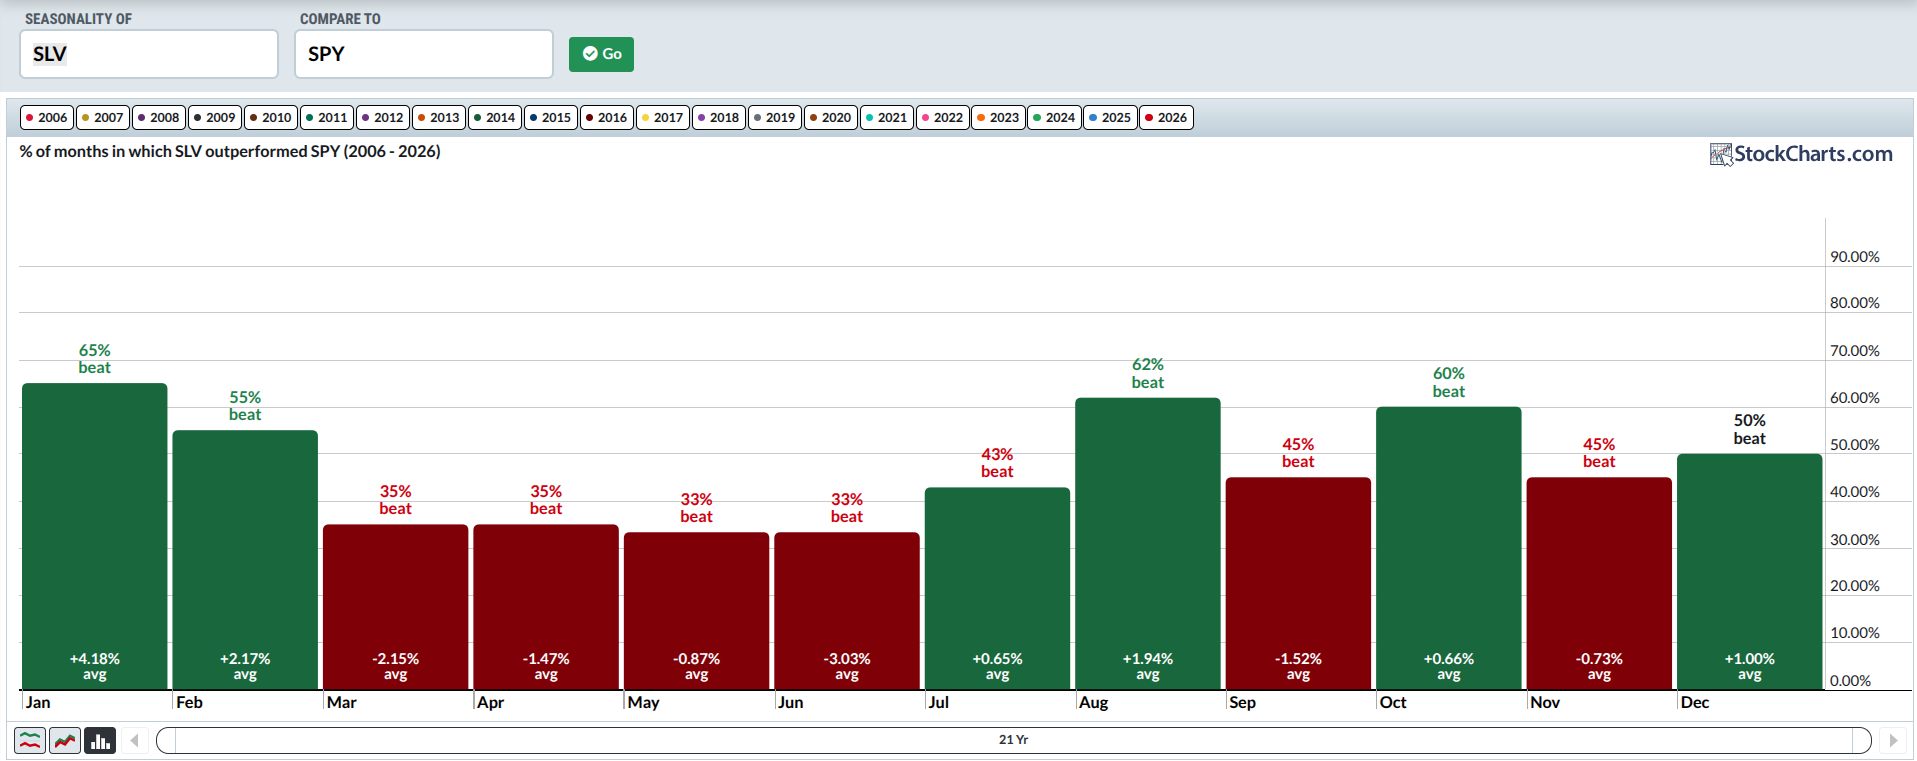
Against the S&P, January still leads with a 65% higher‑close rate and a 4.18% extra return. August is second with a 62% close rate and 1.94% extra gain. June is a red flag: it averages a –3% return and low up‑day frequency.
Insider Tip #2: A single big move can tilt average returns, especially in short samples. Watch for outliers that may mislead you.
Bitcoin Seasonal Trends (2014‑2026)
Bitcoin’s data only goes back 12 years, and the crypto has mostly risen, which pushes its seasonality upward.
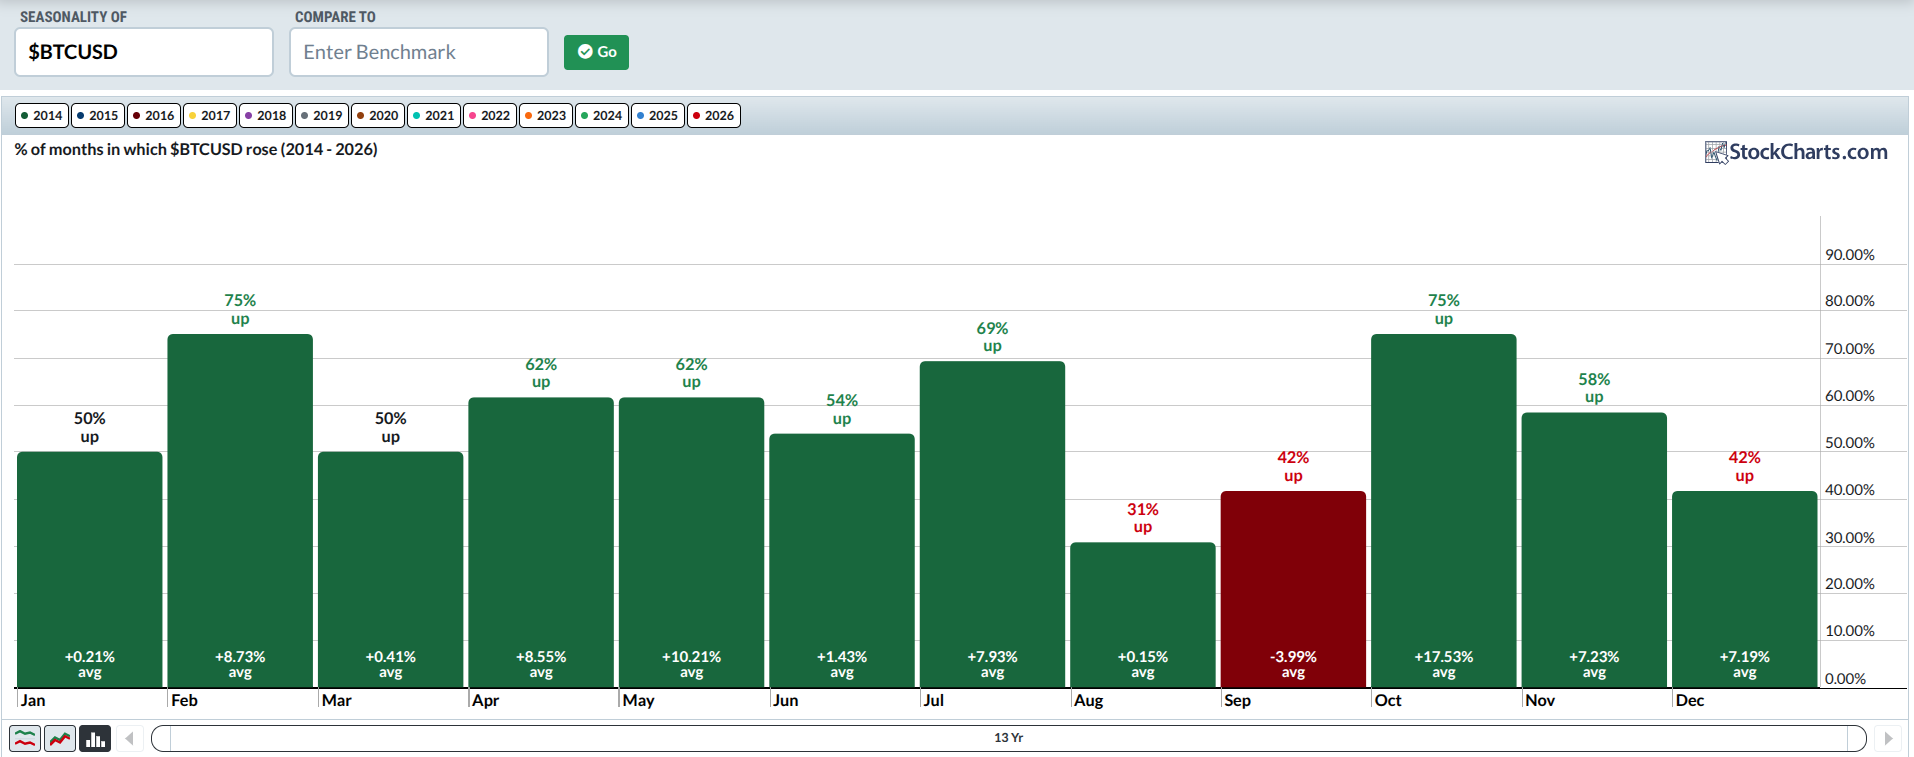
The standout month is “Uptober.” 75% of Octobers close higher, and the average gain is over 17%.
Will the next October repeat? Watch price action and be ready for either direction. That’s the rule for every trade.
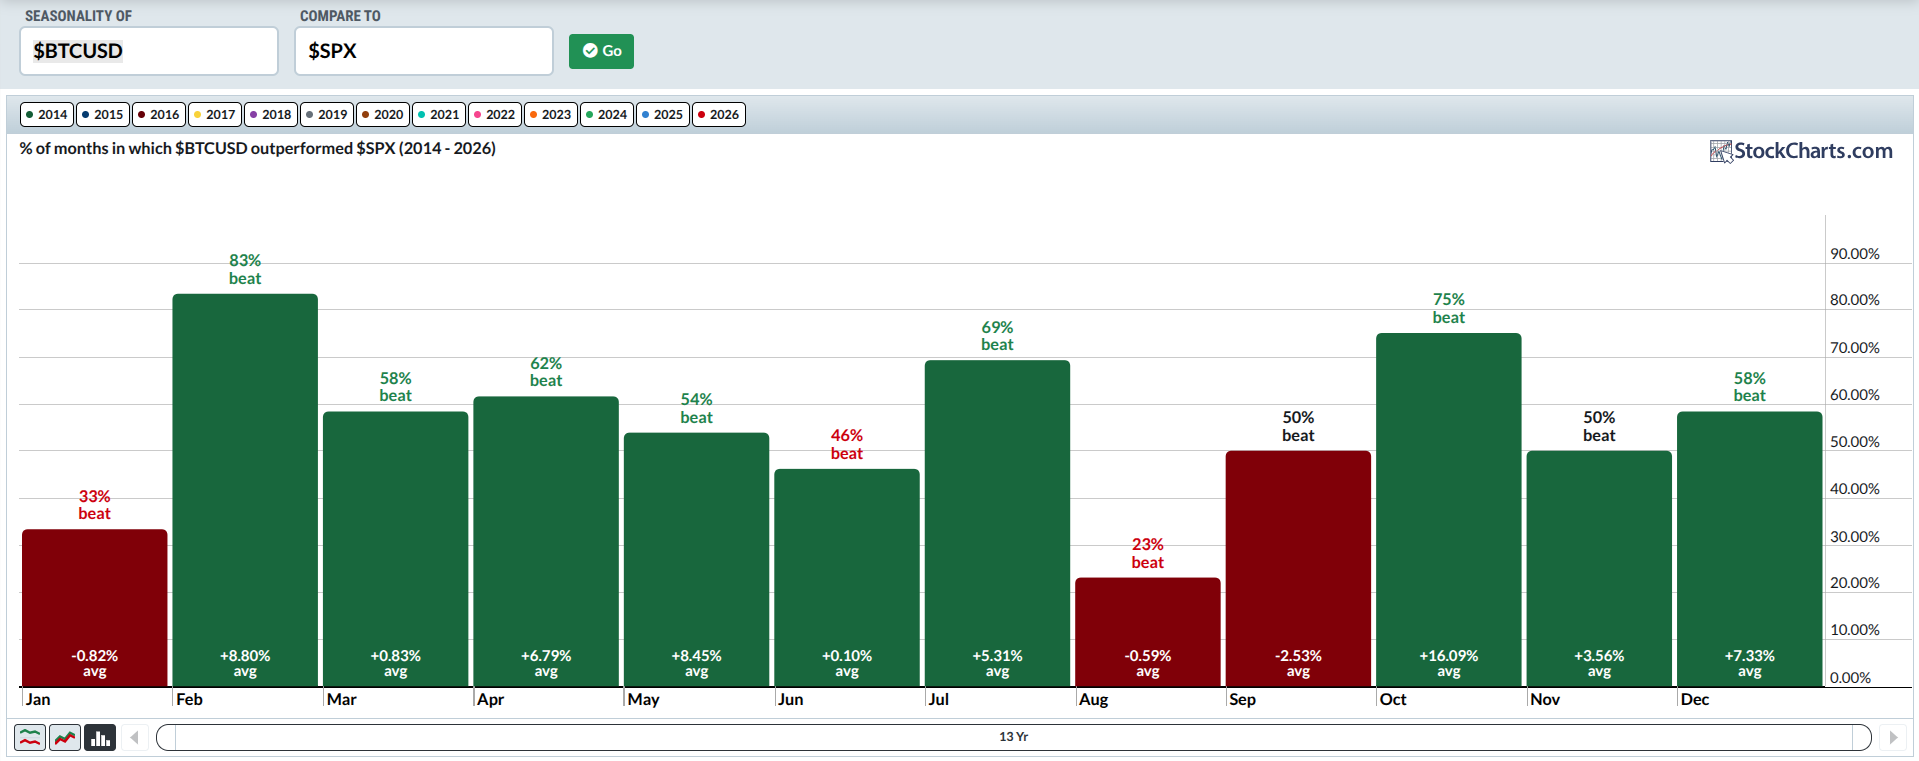
Compared to the S&P, February gives Bitcoin an 83% higher‑close rate, while “Uptober” still delivers a 16%+ average return—the only double‑digit gain on the chart.
Insider Tip #3: “Uptober” earned its name from a few strong Octobers, not every year. Keep an eye on market catalysts—quarter‑end flows, September weakness, or the name itself can all drive the move.
Final Thoughts
Gold, silver, and Bitcoin each have their own seasonal habits. They are often called safe‑haven assets, but Bitcoin is a wild card. Global politics and money policy affect all three, so seasonality is just a background cue. Use it as extra context, not a crystal ball. Play with the seasonality charts, try different time spans, and explore other assets too. Happy charting!
Source: Materials provided by https://articles.stockcharts.com.Note: Content may be edited for style and length.