
For the last 25 Septemberes, the S&P 500 has usually slipped about 0.85%. This September it fell only 0.45%, which is a little better than average.
When we look at the same period but only in mid‑term election years, the index usually drops around 1.5%. Again, a 0.45% loss is milder than the norm.
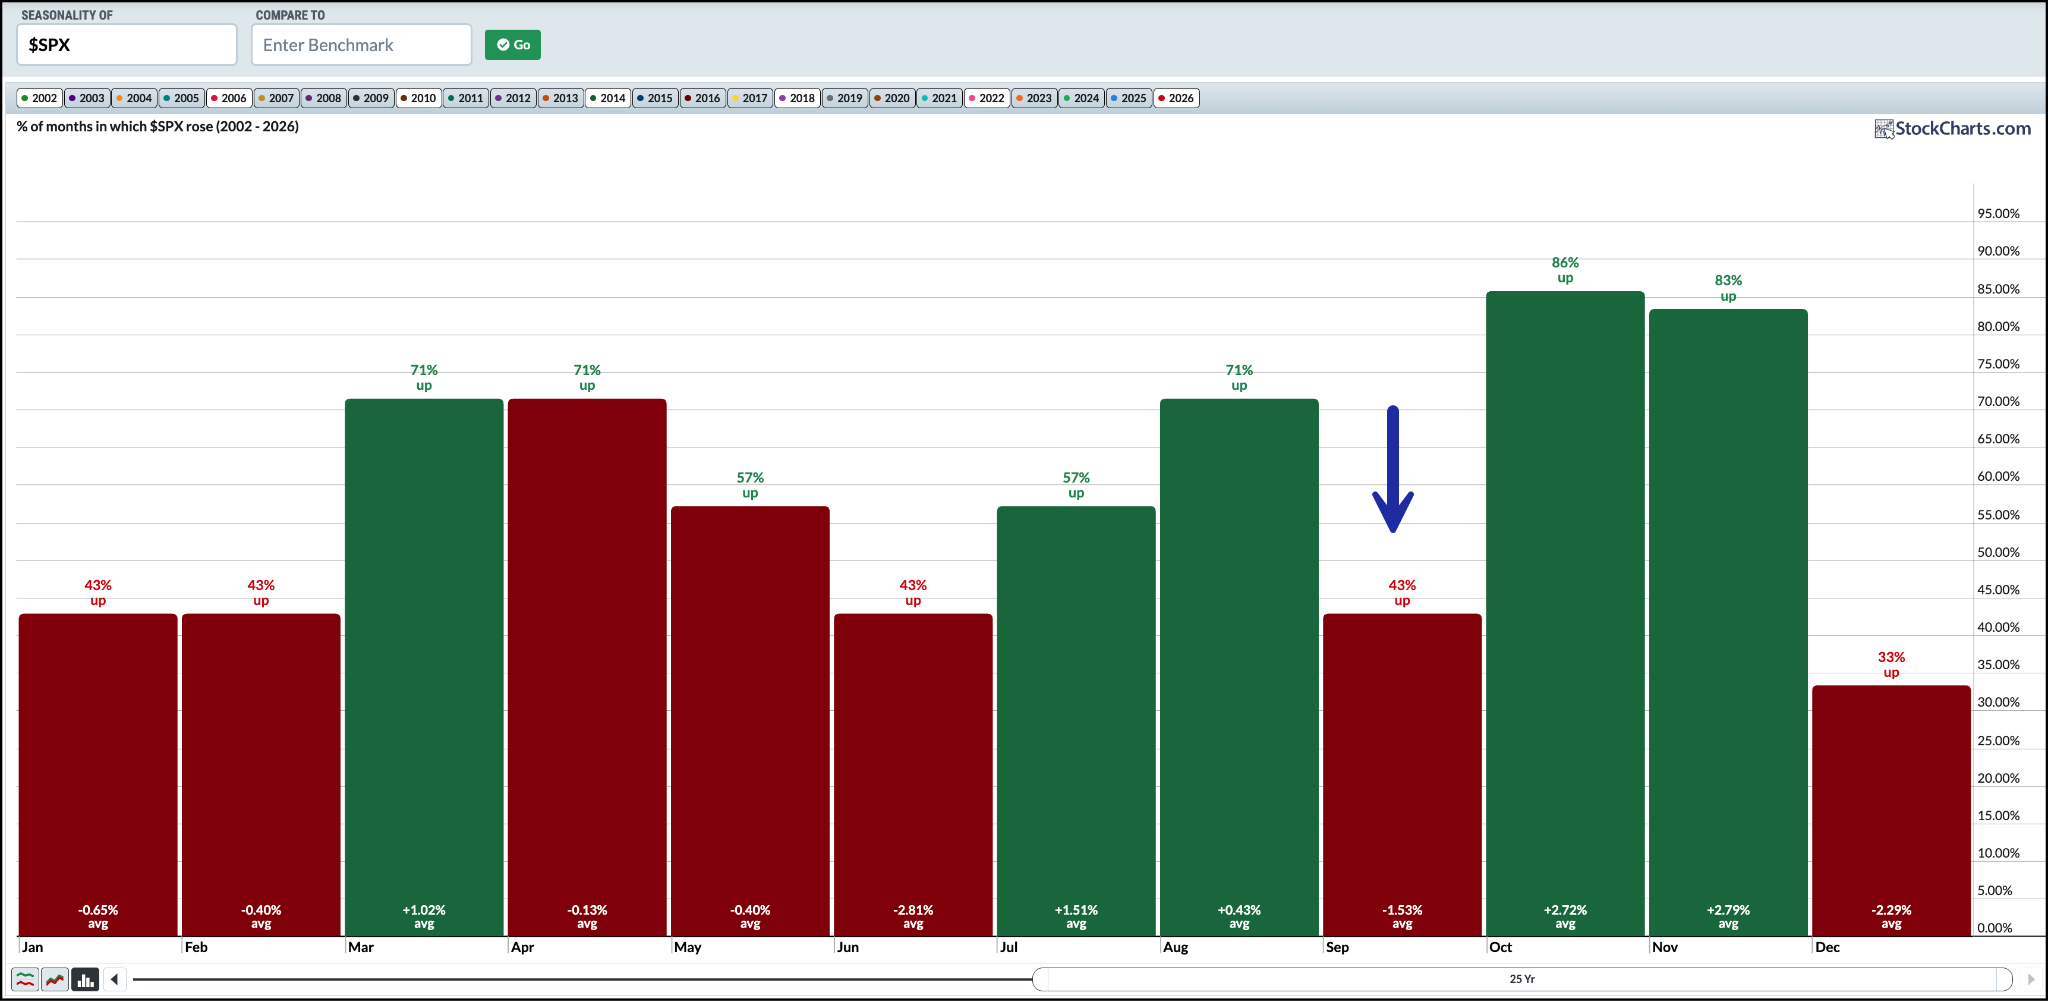
Historically, October and November have been the best months. On average, the index climbs about 2.7% in each of those months.
In the latest trading day, the market started October on a positive note. Transport, mid‑cap and small‑cap groups posted solid gains, while big‑tech names kept the market moving higher.
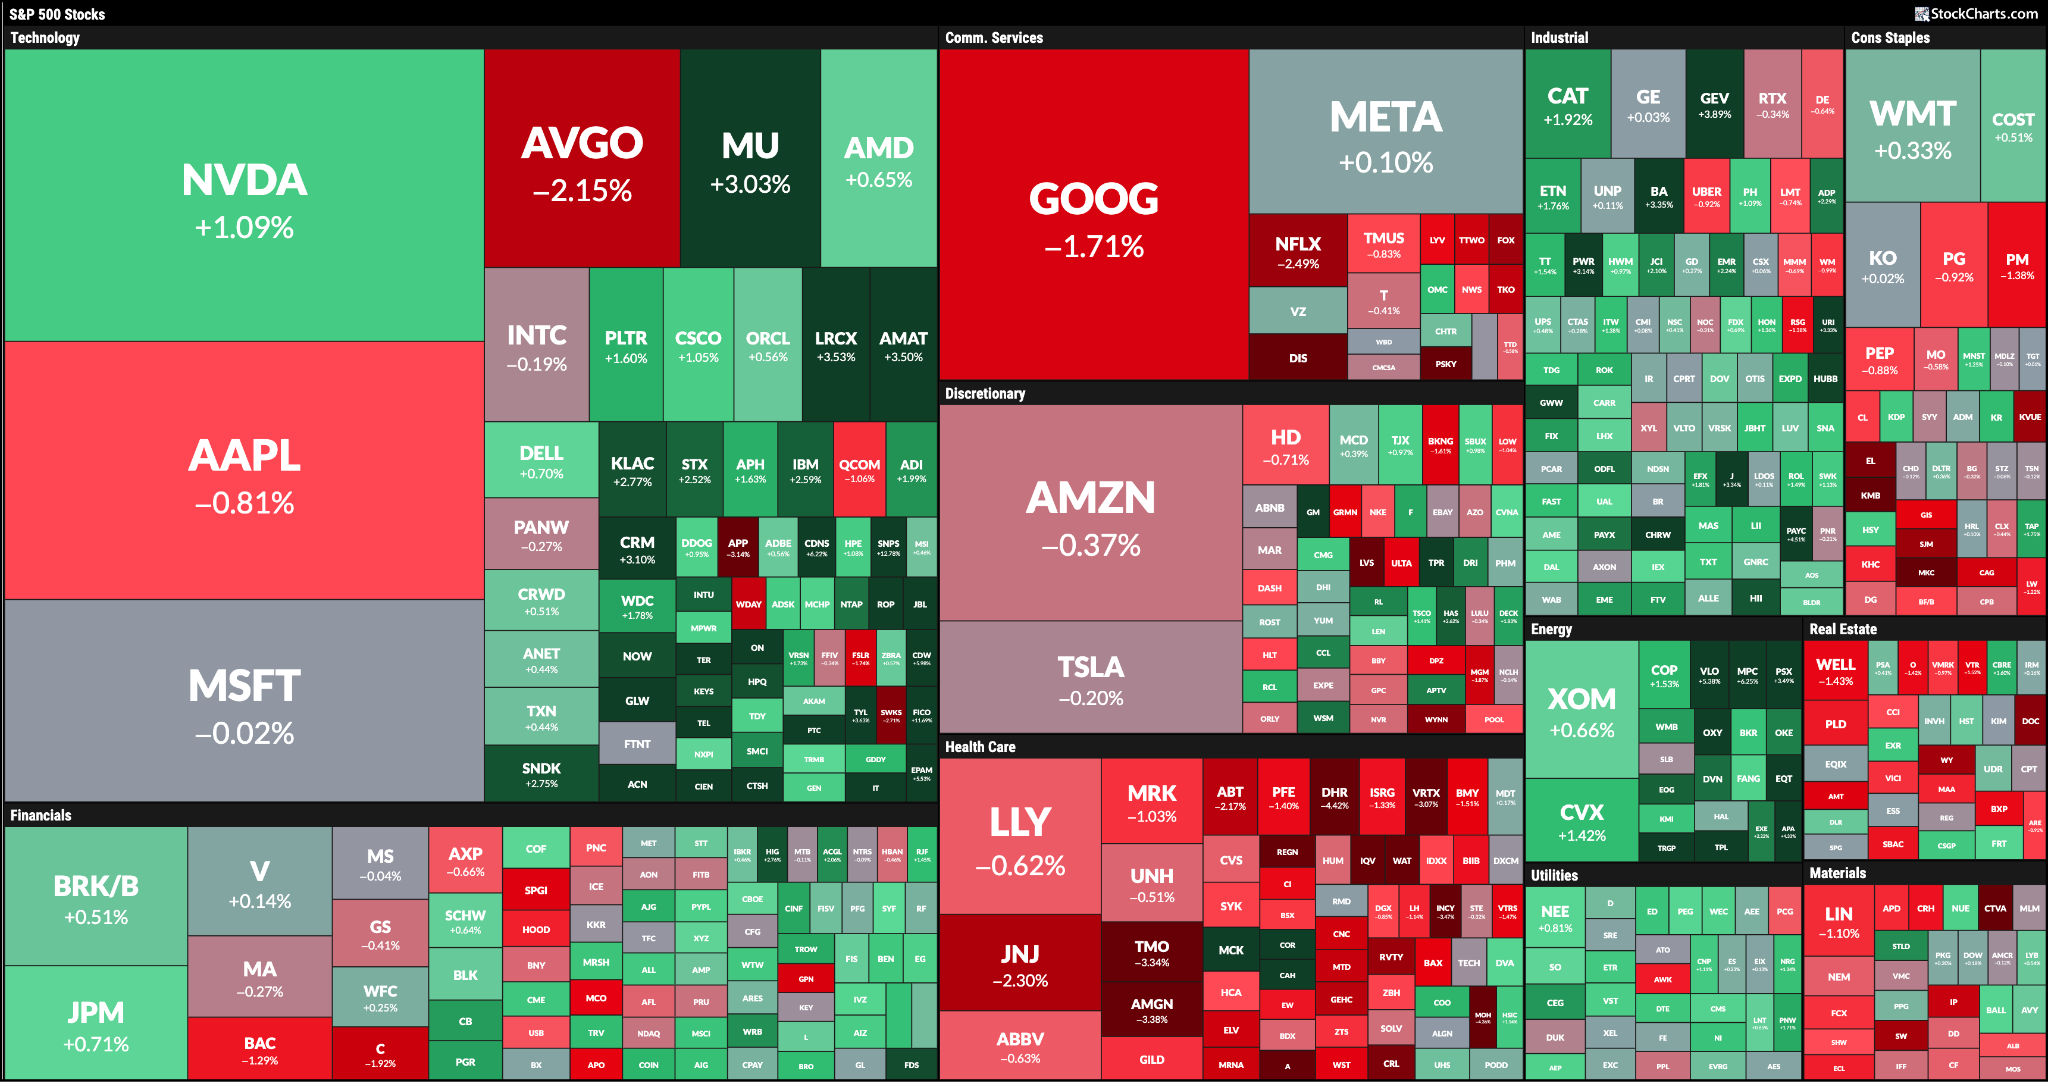
Technology was the second‑best sector after energy. Semiconductor and software stocks such as NVIDIA, Micron and AMD posted good gains.
Microsoft opened strong but faded later, ending lower. Apple and Broadcom also closed in the red.
The VanEck Semiconductor ETF moved above a tight range, but a clear breakout still needs confirmation.
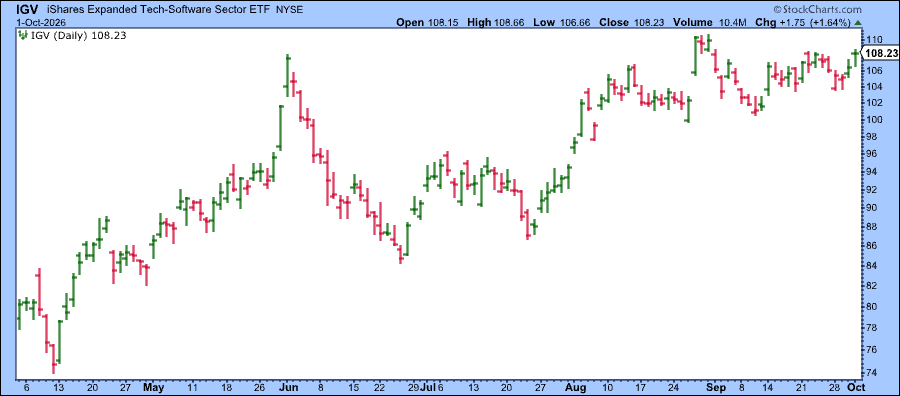
The iShares Expanded Tech‑Software ETF stayed near its opening level, showing a lack of buying pressure to push it higher.
Will tech keep pulling the market upward this week? The September non‑farm payroll report on Friday could give us a clue.
Besides tech, groups like transportation, regional banks, homebuilders and retailers are still falling behind the S&P 500. If these groups start to bounce, they could offer good buying chances, especially the interest‑rate‑sensitive homebuilders and banks.
How to Spot Stocks in Specific Groups
Using a stock screener makes it easy to filter stocks by sector or industry. For example, choose the Financial sector to get a list of about 75 stocks. Then narrow the list by selecting the "Banks" industry, which leaves roughly 13 stocks – a manageable number.
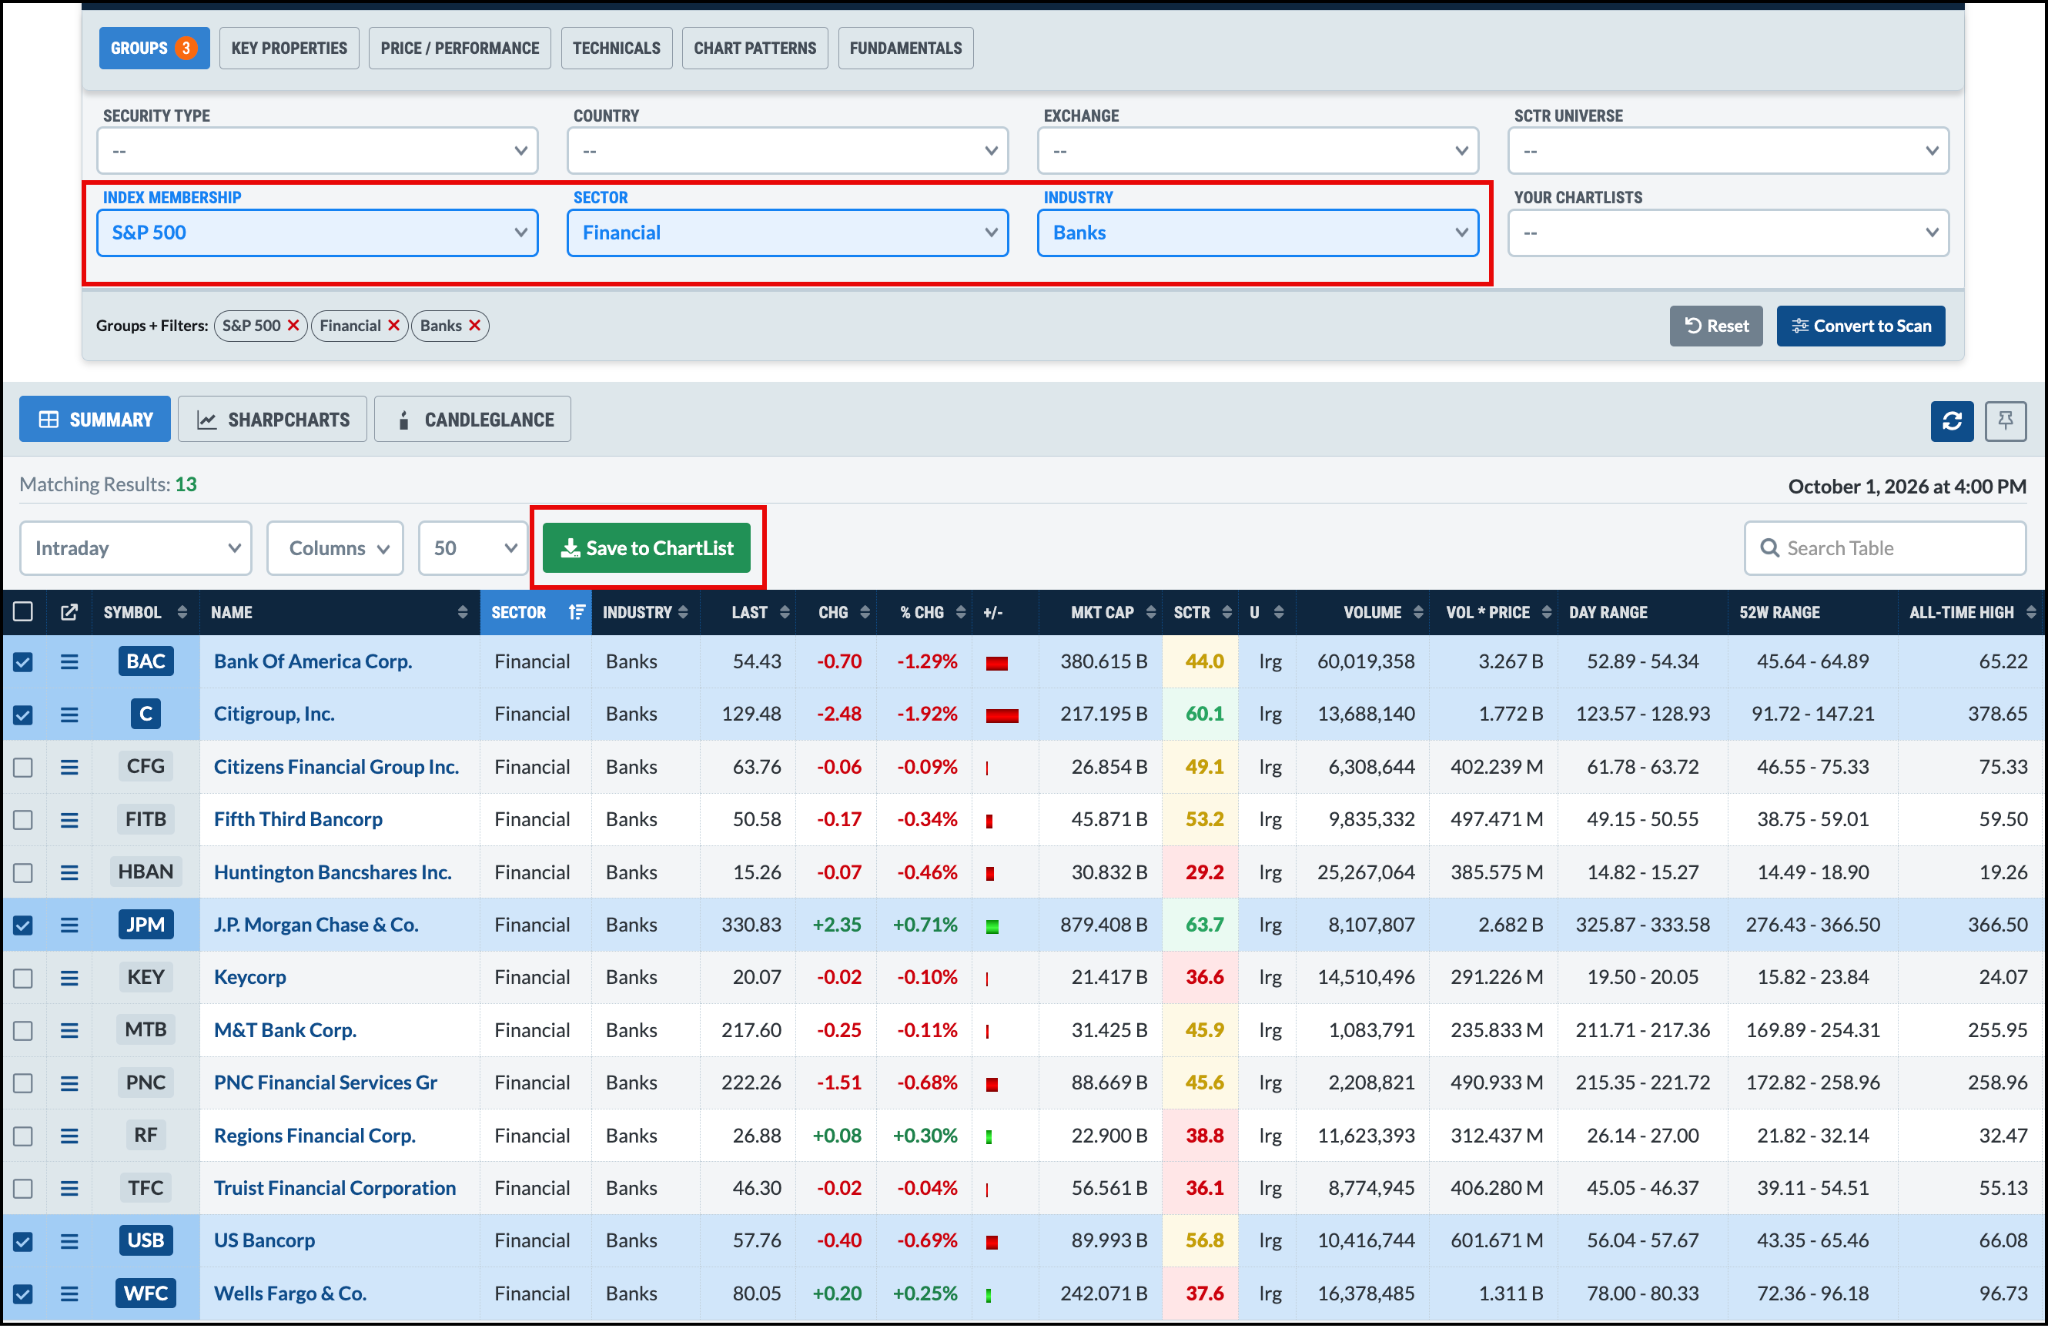
After you pick the stocks you like, add them to a watchlist. Then you can study each chart with your favorite technical tools and decide if the price is near a possible entry point.
Bottom Line
The market stands at an interesting spot. Prices keep climbing even as Treasury yields and oil rise. The AI‑driven rally, led by technology, is a big part of that strength.
The next step may depend on whether broader groups—like transports, banks, homebuilders and retailers—join the rally. More participation would give the market a firmer base and a brighter October.
Disclaimer: This article is for educational purposes only and does not constitute financial advice. Always consider your personal situation and consult a professional before making investment decisions.
Source: Materials provided by https://articles.stockcharts.com.Note: Content may be edited for style and length.