

The Nasdaq 100 has dropped more than it has in months. This makes investors pause and think about what could happen next.
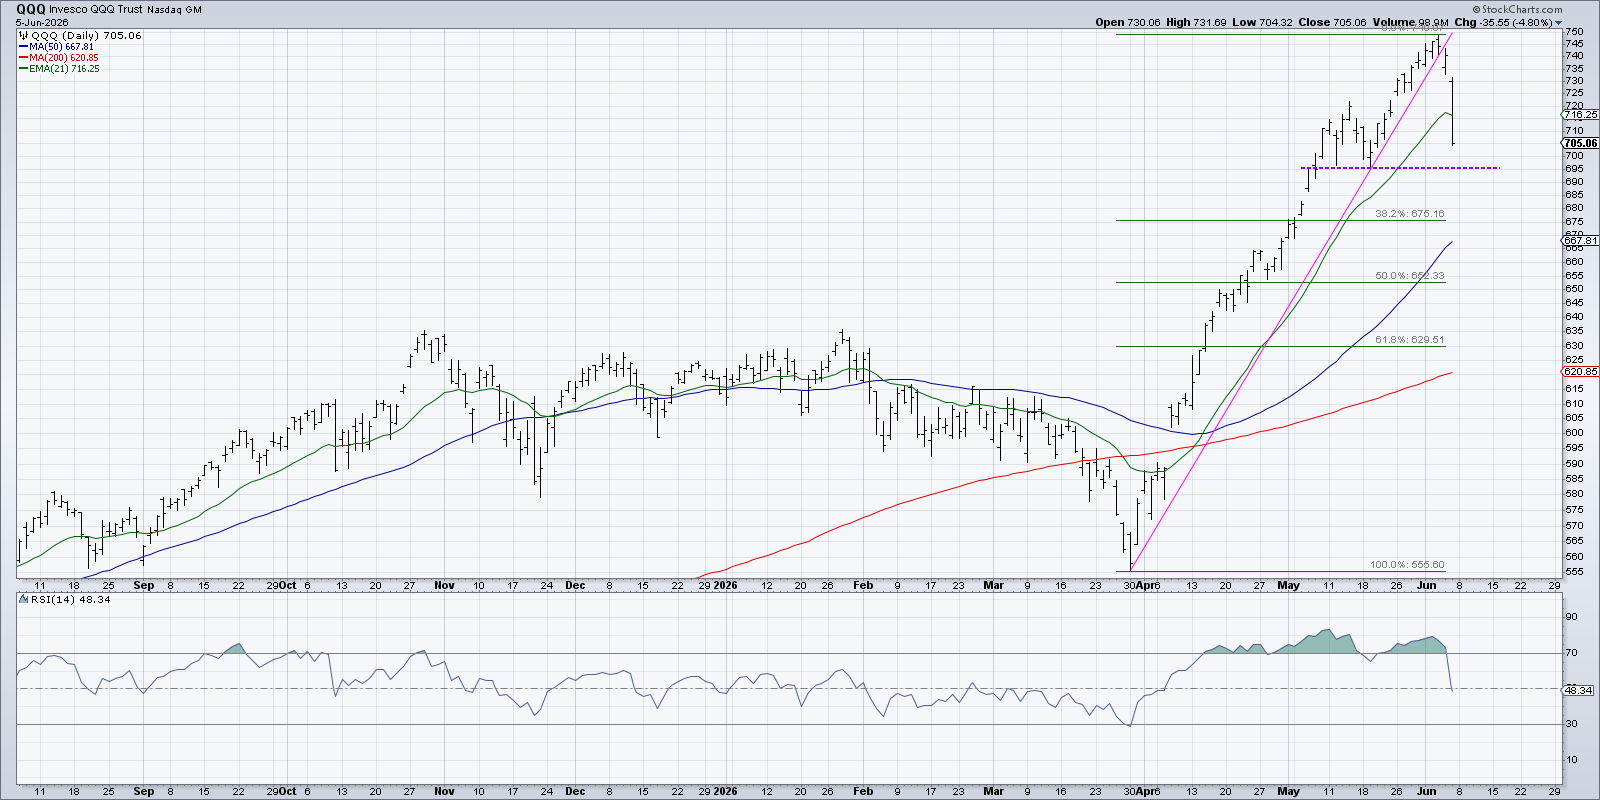
Growth stocks that rose strongly from March to May are now slipping. Some people think this is just a short‑term correction, while others fear a bigger shift away from tech.
Instead of guessing, let’s look at four possible futures for the Nasdaq 100 over the next six to eight weeks. Pick the one you think is most likely and think about how it would affect your holdings.
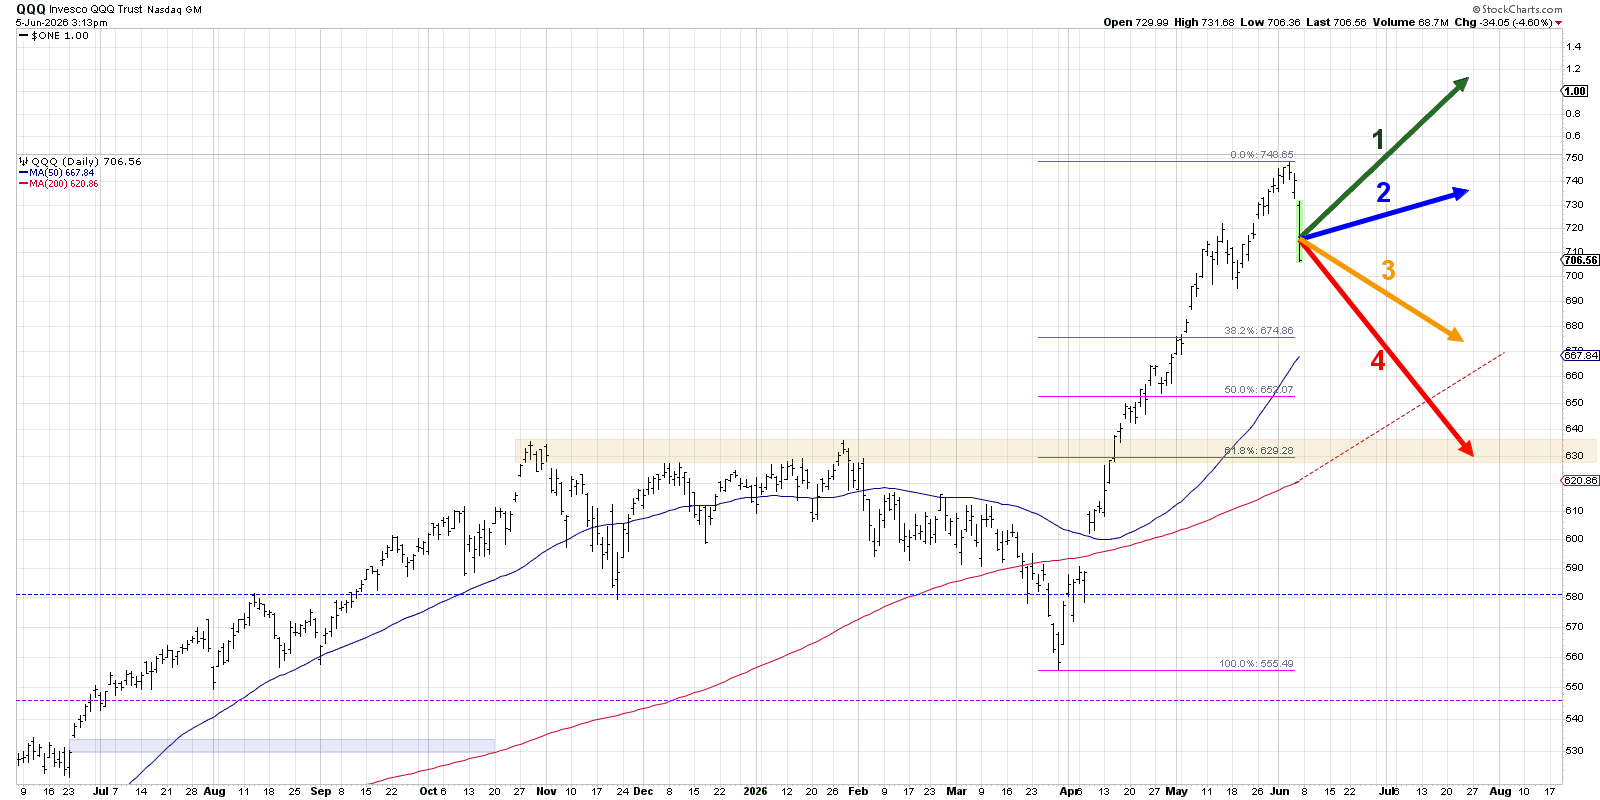
Here are the four scenarios for the Nasdaq 100 ETF (QQQ) through late July 2026.
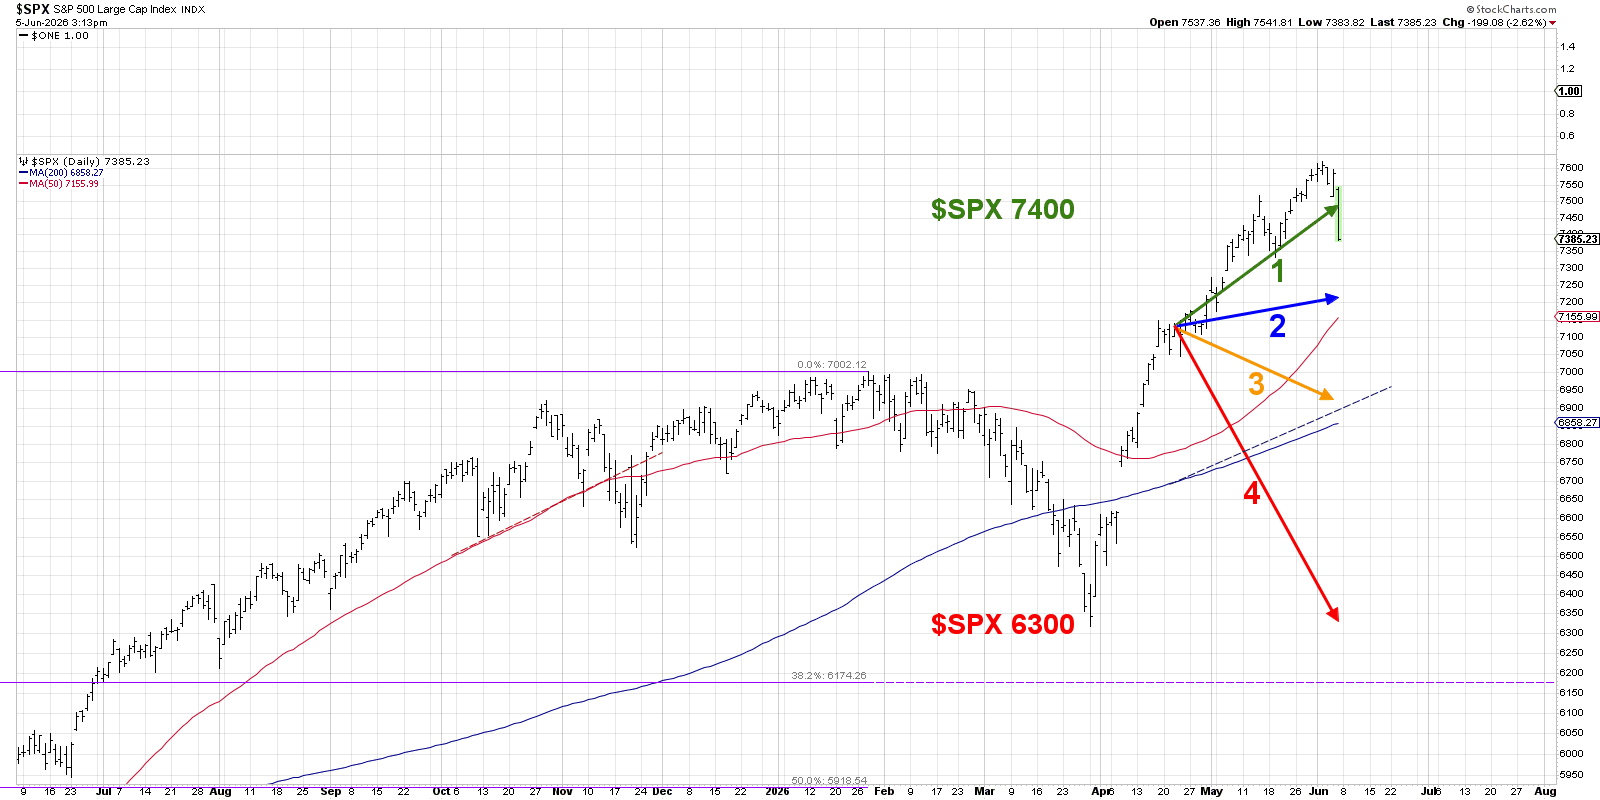
Scenario 1 – Super Bullish
In the best case, the recent dip is only a brief pause. Buyers jump in, especially for AI, semiconductors and big‑cap tech. The Nasdaq 100 climbs again toward new record levels, perhaps reaching around 780 on the QQQ by late July.
Investors would need to see the fall as a buying chance, not a sign of a larger shift.
Probability: 5 %
Scenario 2 – Mildly Bullish
Tech still feels pressure, but the overall market stays positive. Money moves into financials, consumer staples, industrials and health‑care while tech consolidates. The Nasdaq 100 may stall near its early‑June highs, while the S&P 500 and Dow perform a bit better.
This picture shows a market that is still up but less dependent on a few growth names.
Probability: 25 %
Scenario 3 – Mildly Bearish
Higher interest rates and strong economic data make investors doubt the Fed’s future moves. As rates rise, the value of future earnings for growth companies falls, hurting tech stocks. The Nasdaq 100 slides to around the 38.2 % Fibonacci level near 675 on the QQQ.
Value‑oriented sectors gain, but the long‑term trend stays intact.
Probability: 55 %
Scenario 4 – Super Bearish
The pull‑back could be the first step of a larger decline. Investors flee to defensive areas like utilities, consumer staples and real estate. The Nasdaq 100 may fall to about 630, a 61.8 % retracement of its rally, and dip below its 200‑day moving average.
History shows that mid‑term election years often see weakness from May to October, so this outcome matches a known pattern.
Probability: 15 %
What Do You Think?
- Scenario 1: Pull‑back is a buying chance.
- Scenario 2: Healthy rotation, market stays constructive.
- Scenario 3: Rate‑driven correction moves money to value.
- Scenario 4: Larger decline begins, defensive sectors take over.
Thinking through these possibilities helps you stay prepared and avoid surprise moves in the market.
Source: Materials provided by https://articles.stockcharts.com.Note: Content may be edited for style and length.