
The S&P 500 ended last Thursday with about a 1% rise. The list of the five best‑performing sectors stayed the same, even though a few moved up or down in rank.
Top Five Sectors Stay the Same
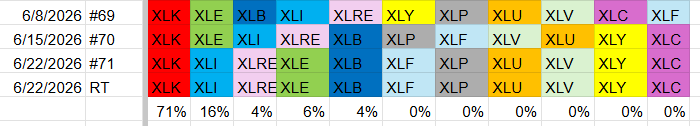
Technology kept the lead. Industrials moved up to second place, Real Estate climbed to third, Energy slipped to fourth, and Materials stayed fifth.
In the lower half, Financials moved to sixth, Consumer Staples to seventh, Utilities to eighth, Health Care to ninth, while Consumer Discretionary and Communication Services held the tenth and eleventh spots.
- Technology – XLK (71%)
- Energy – XLE (6%)
- Industrials – XLI (16%)
- Real Estate – XLRE (4%)
- Materials – XLB (4%)
- Financials – XLF
- Consumer Staples – XLP
- Health Care – XLV
- Utilities – XLU
- Consumer Discretionary – XLY
- Communication Services – XLC
Weekly Relative Rotation Graph
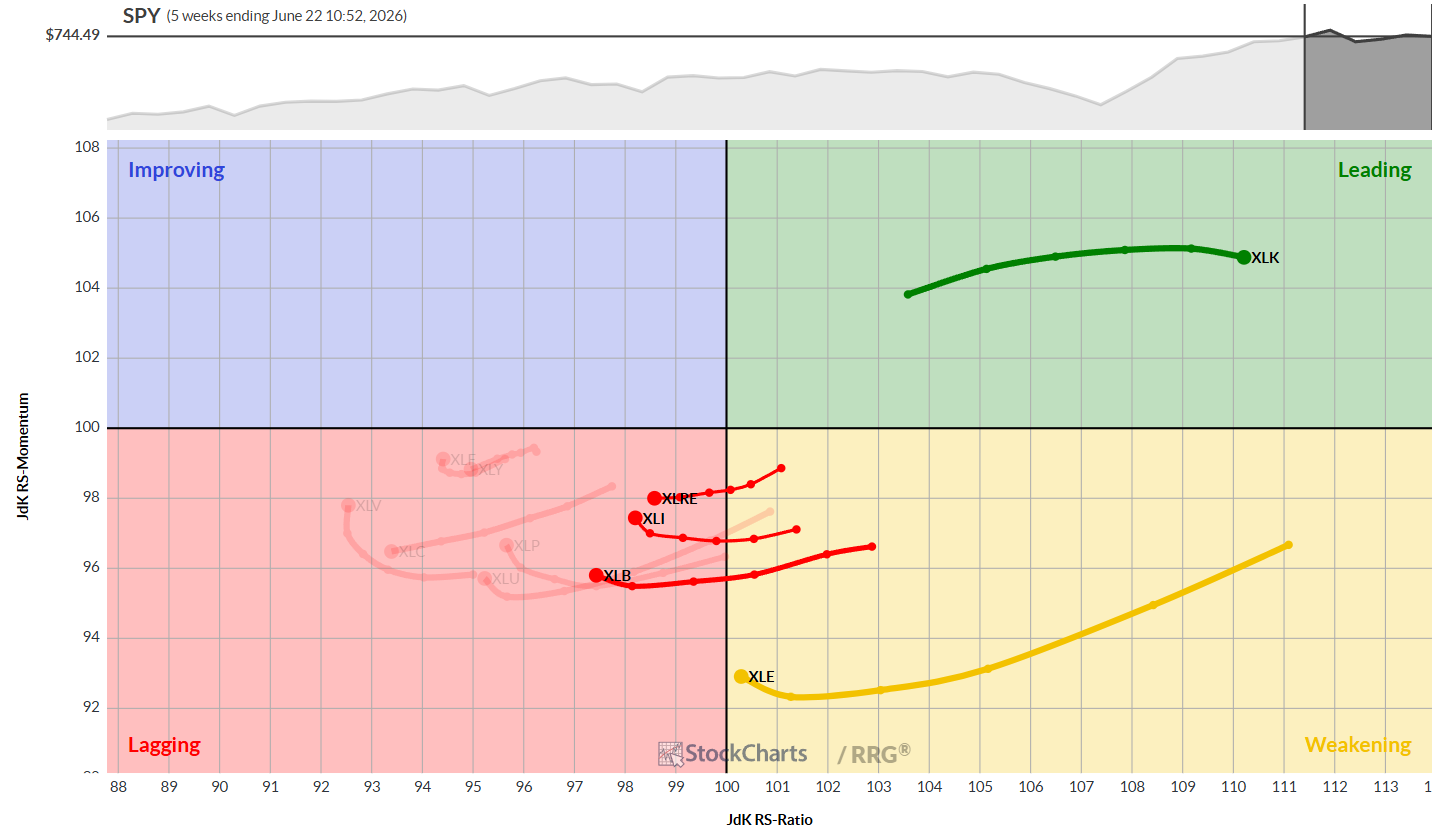
The weekly RRG shows only the tech sector in the leading quadrant. Energy sits in the weakening area and is close to slipping into lagging. Materials, Industrials and Real Estate are in lagging but still beat most other sectors there. No sector appears in the improving quadrant.
Daily Relative Rotation Graph
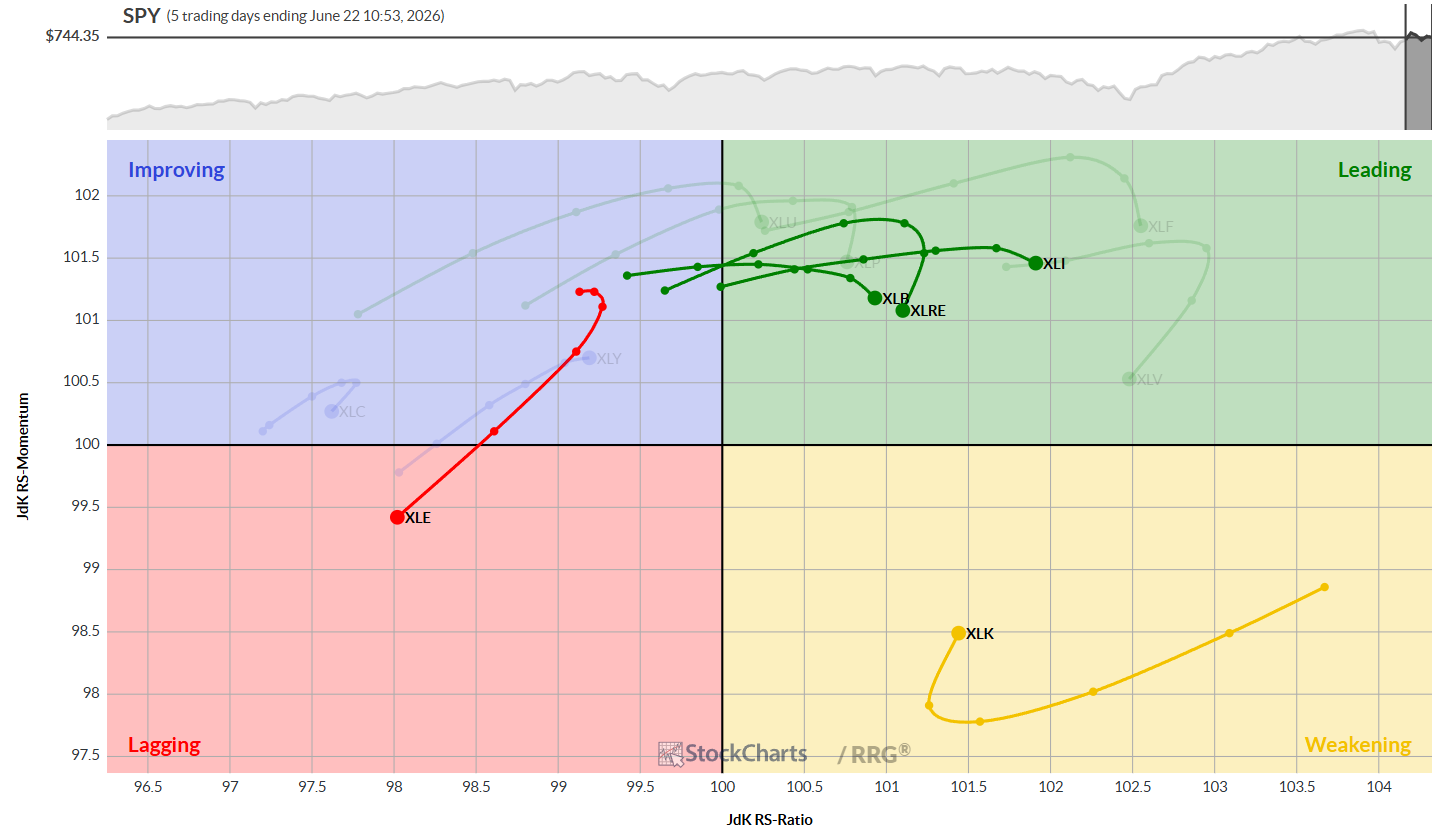
On the daily chart, tech is gaining strength again and is moving back toward the leading quadrant. Materials, Industrials and Real Estate sit in the leading area, though Real Estate is losing some momentum. Energy has been bouncing around and looks weak for the weeks ahead.
Sector Highlights
Technology
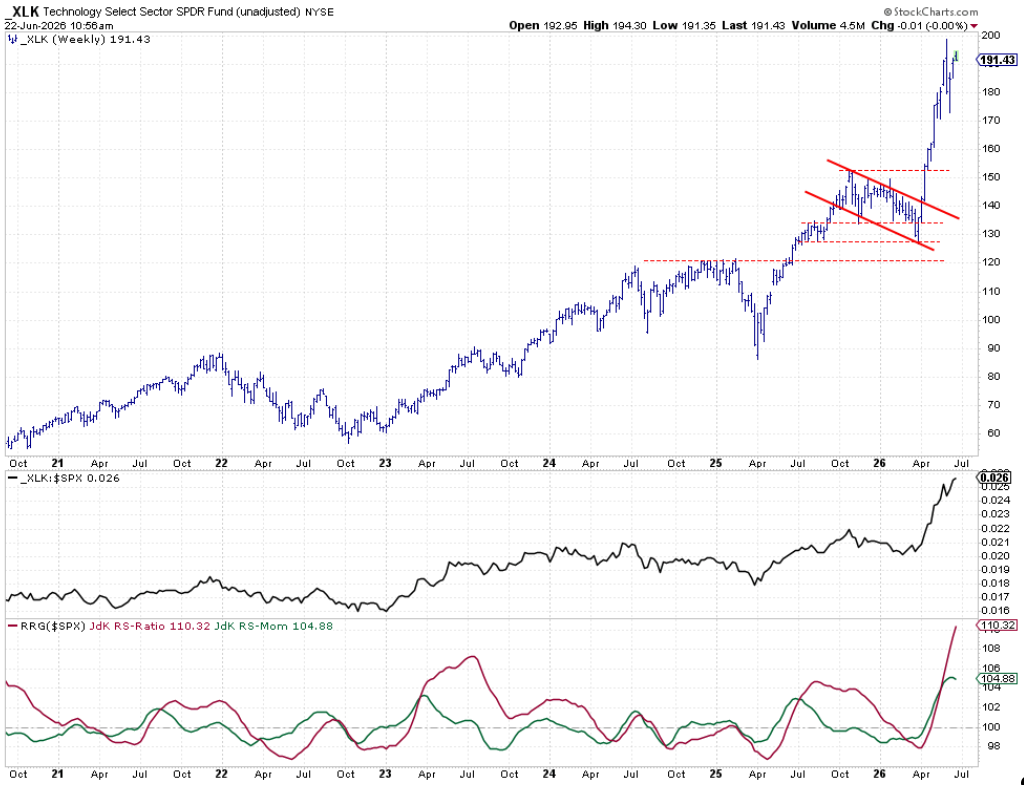
Tech keeps moving higher, testing recent highs on both price and relative strength charts. This steady rise keeps it at the top of the list.
Industrials
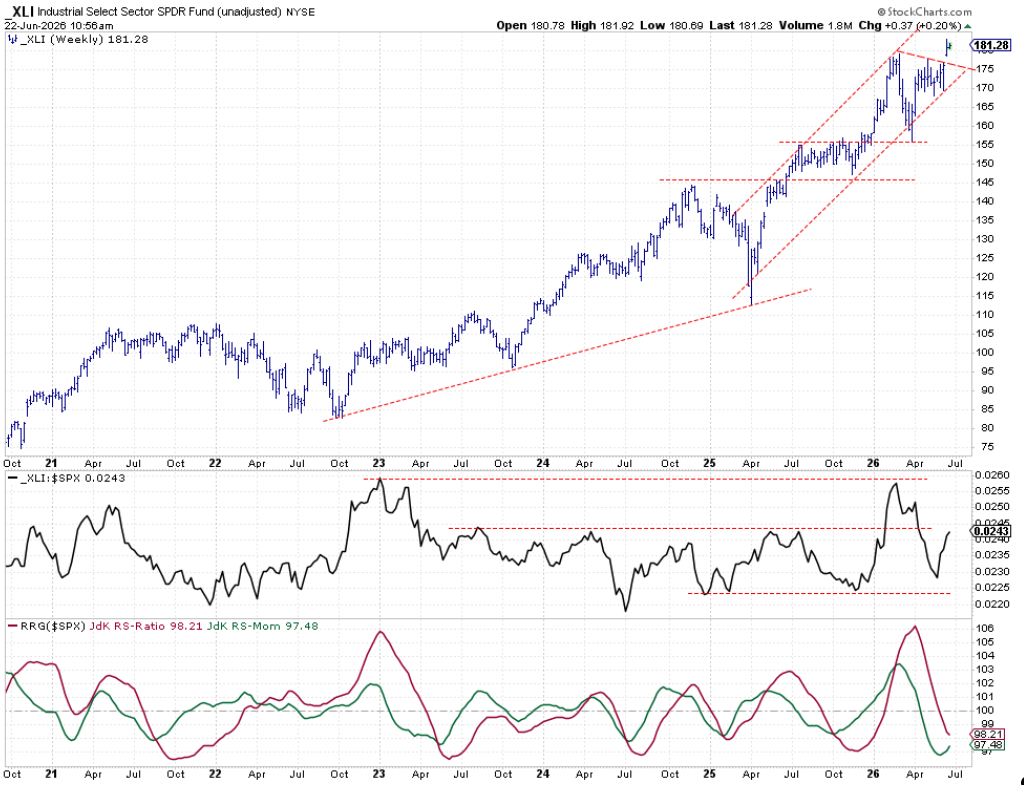
Industrials broke out of a flat pattern and are now riding a rising channel. Both the raw strength line and its momentum are turning upward, hinting at more gains.
Real Estate
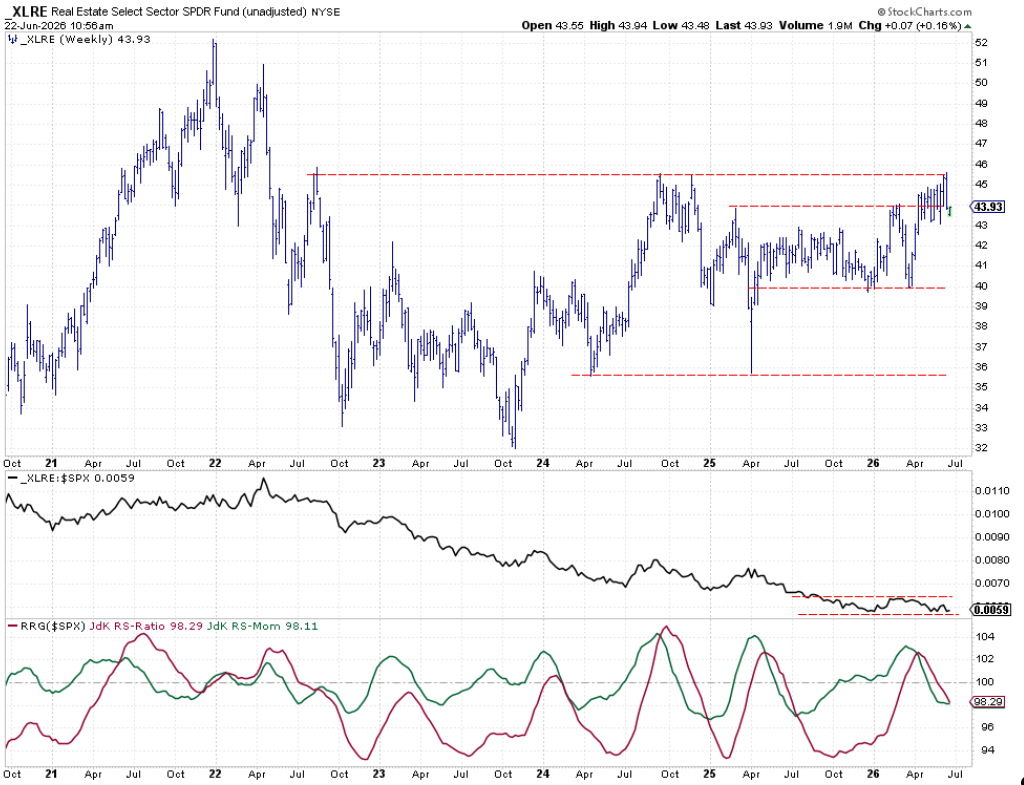
Real Estate is testing a resistance level just above 45, with support near 43. The price has moved sideways, giving the strength line a chance to steady.
Energy
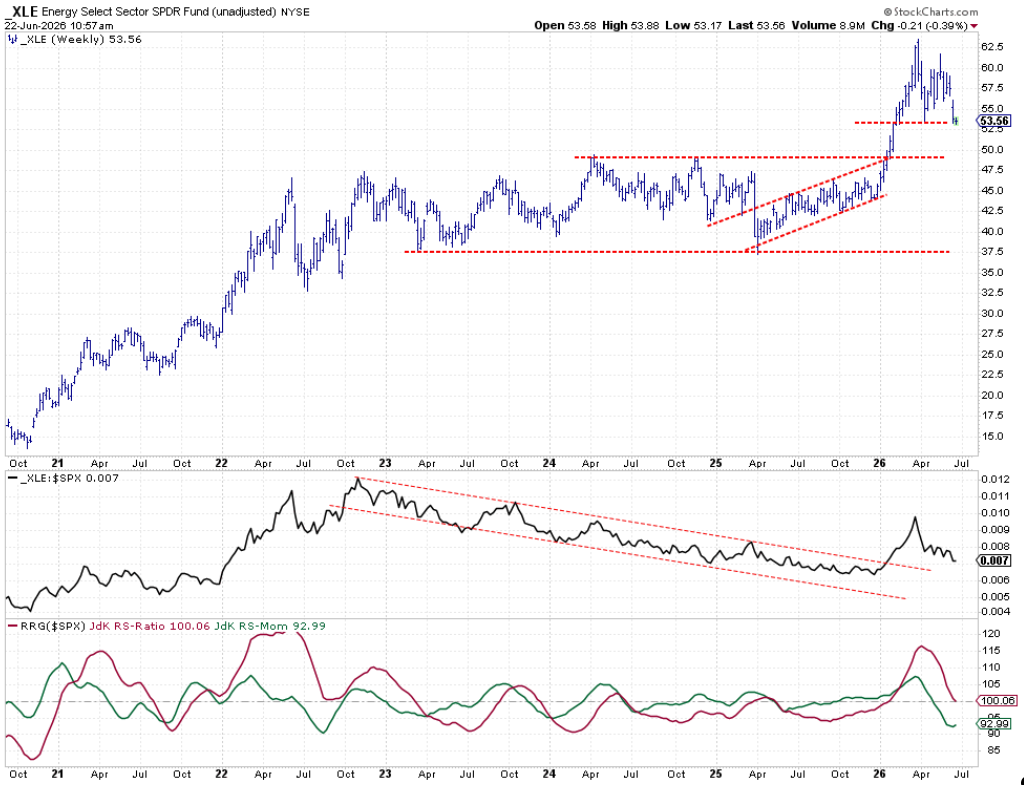
Energy broke down from a small triangle and now rests around 53‑53.5. If that support fails, the next drop could be below 50. Its relative strength is falling, which may push it out of the top‑five.
Materials
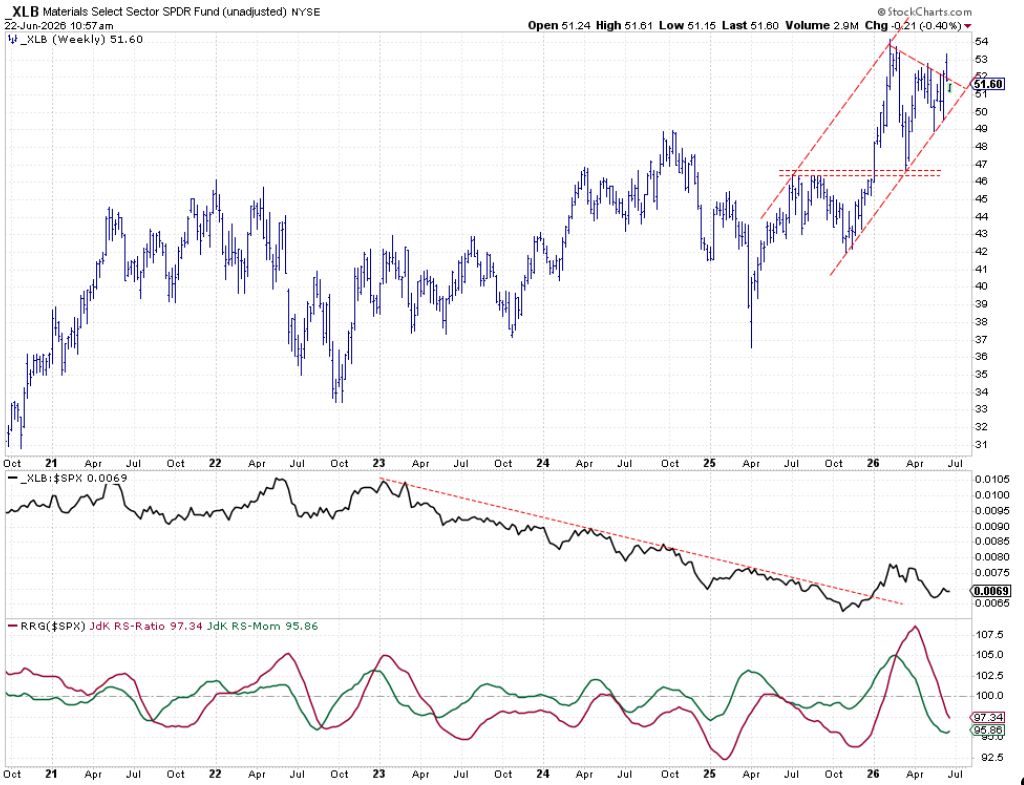
Materials have slipped back into a consolidation pattern with resistance just over 53.5. Prices stay in a rising channel, but momentum has flattened. More strength is needed to move back into a better quadrant.
Portfolio Performance Update
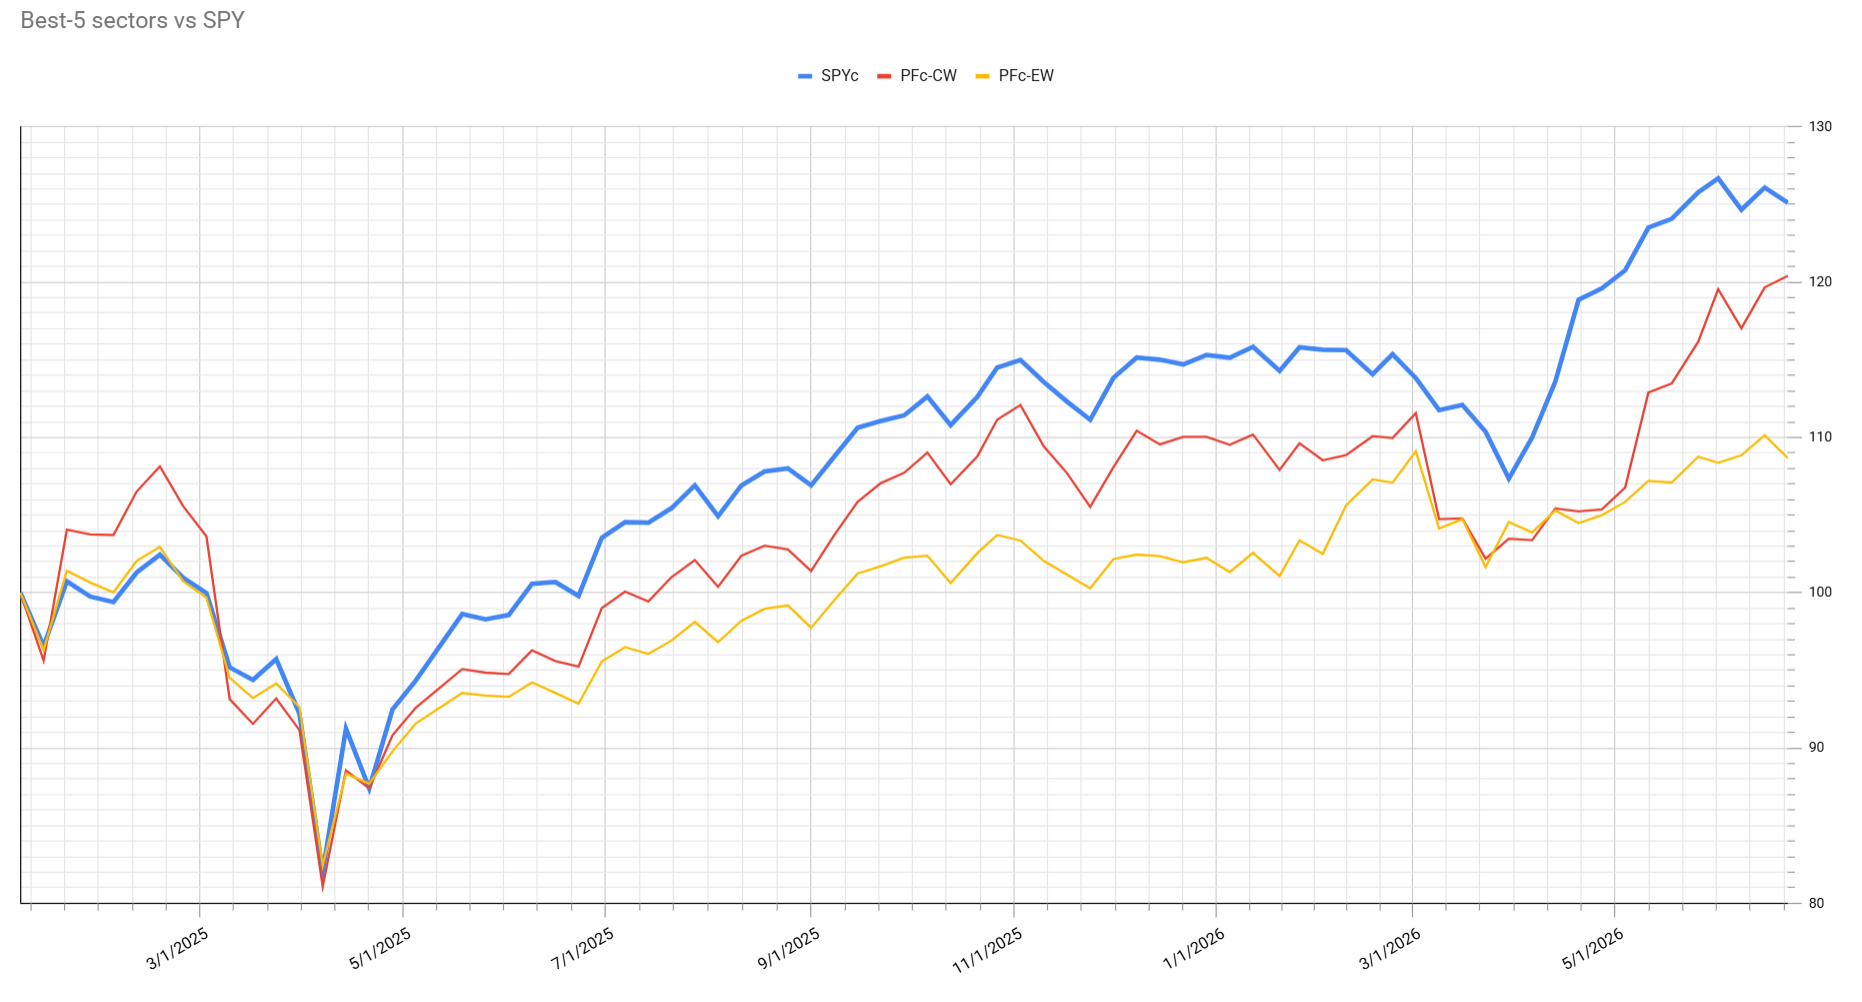
Strong tech gains helped the cap‑weighted portfolio narrow its gap with the S&P 500 to less than 5% by week’s end. A small pull‑back early in the week gave back some gains, but the focus stays on the final numbers. The portfolio is slowly catching up, and future weeks will show if it can beat the index.
#StayAlert
Source: Materials provided by https://articles.stockcharts.com.Note: Content may be edited for style and length.