

Before we start…
Imagine you could see exactly how active money managers are betting on stocks. Not what they say, but what they really do with cash. The NAAIM Exposure Index does that. It shows the real equity exposure of a group of active managers. This picture can give you extra clues for your own trades.
What is the NAAIM Exposure Index?
The index measures the average U.S. stock exposure that active managers, who belong to the National Association of Active Investment Managers (NAAIM), report each week. About 130 member firms take part, but only those who answer the survey are counted. Even though the sample is small, it still offers a useful snapshot of how tactical managers feel about the market.
How is the data collected?
Every Thursday the index is published. Managers send in their total equity exposure after the market closes on Wednesday. The numbers mean:
- 100% – fully invested long
- Above 100% – leveraged long
- 0% – market neutral or cash
- Negative values – net short
Values have swung from about –200% (deep short) to +200% (highly leveraged long). The index is a sentiment gauge, but it measures real positioning, not feelings. It does not predict moves; it simply gives context.
Reading the levels
Because the index blends many managers and strategies, you must interpret it carefully. Rough guidelines are:
- Below 30‑40 – defensive, low risk appetite (bearish zone)
- 40‑70 – balanced, moderate risk (neutral zone)
- Above 80 – aggressive, risk‑on (bullish zone)
- Above 100 – leveraged long, very confident
What happens at extremes?
Extreme readings can hint at turning points, but they are not guarantees.
Index above 100
Managers are heavily invested, sometimes with leverage. This can mean a strong trend, but it may also signal that buying power is running low. If the market tops, the index may stay high while price stalls.
Index near 20 or lower
Managers are protecting capital or even shorting. This often appears in a down market, yet a low reading can also show that the market is near a bottom and a small amount of buying could lift prices.
Using the index for dip buying
Tip: In a strong uptrend, dips in the index below 60, and sometimes below 40, can point to buying opportunities.
This is not a strict rule, just an observation. When the broader market trend stays intact, a lower index reading often means managers are trimming risk, not abandoning the rally. The exact signal depends on how you define the uptrend—moving averages, Zig‑Zag lines, or other tools.
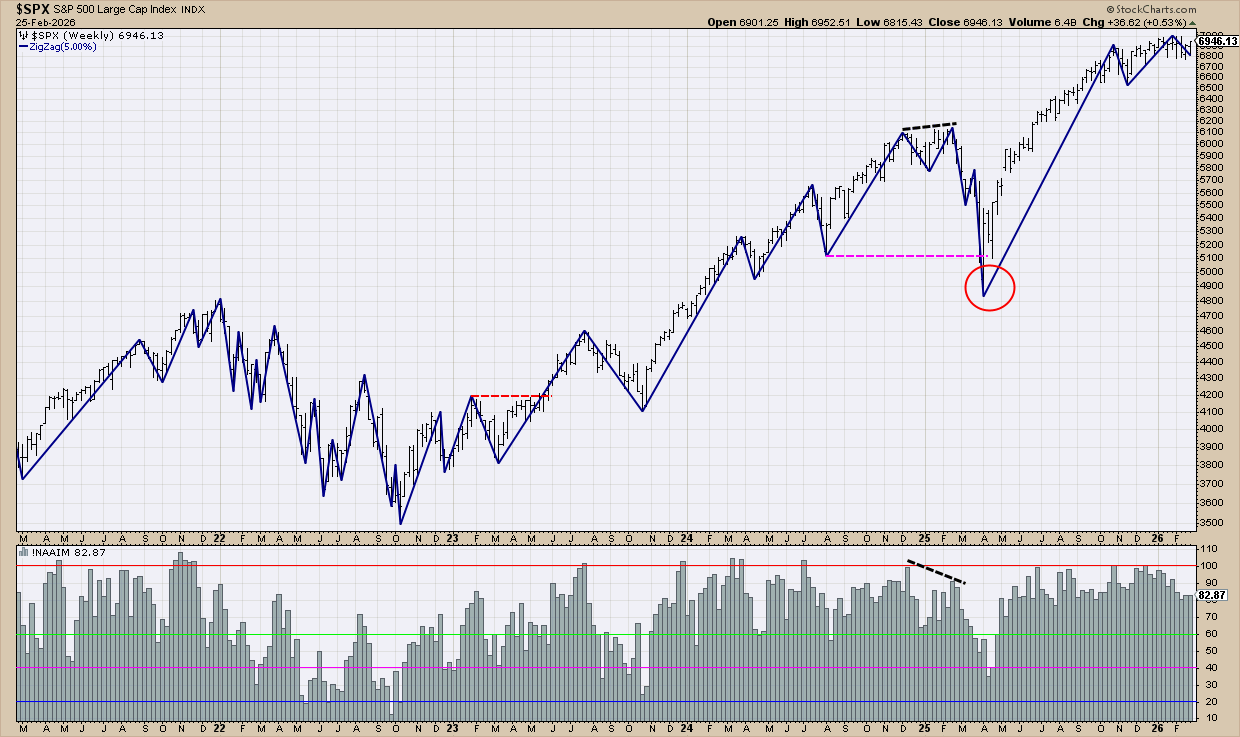
When the index climbs above 100, it shows strong bullishness, but it does not always warn of a reversal. More useful is the divergence: if prices rise while the index falls, a correction may follow.
Conversely, dips into the 60‑40 range can be buy‑the‑dip signals if the market is still making higher highs and higher lows. A broken swing low, however, weakens the signal.
Try it yourself
Test the index with different trend tools. Watch how exposure behaves during pullbacks and breakouts. Remember, the NAAIM index is a risk gauge, not a timing machine. Using it as context can often improve the timing of your trades.
Bottom line
The NAAIM Exposure Index shows how active managers position themselves. When the index moves with price, momentum tends to continue. When it diverges, risk conditions may be shifting. Treat the index as a positioning guide, not a trigger, and you’ll add a valuable layer of insight to your trading decisions.
Source: Materials provided by https://articles.stockcharts.com.Note: Content may be edited for style and length.