

Energy markets are buzzing. When oil prices go up, clean‑energy stocks often follow. In 2026 the trend is clear: clean‑energy funds are gaining ground faster than the broader market.
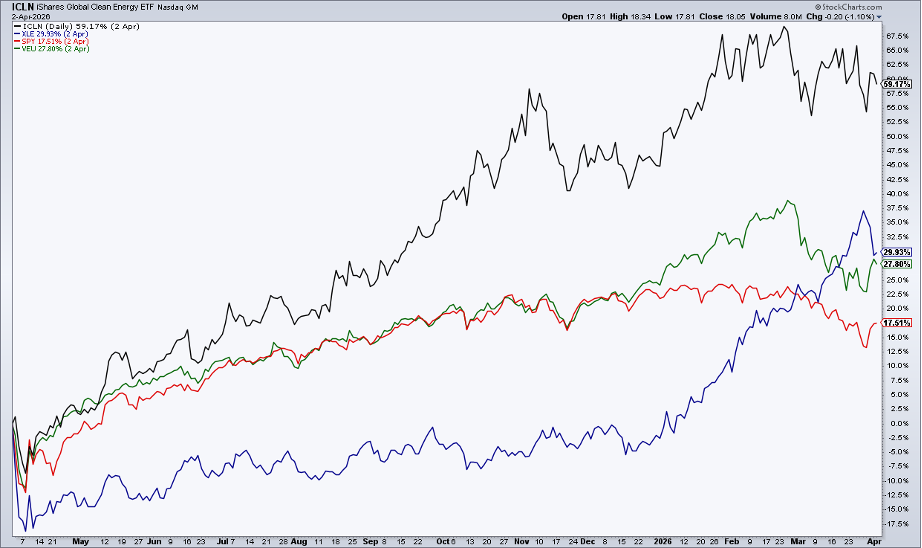
The iShares Global Clean Energy ETF (ICLN) has risen about 59 % this year, beating the S&P 500 and many international indexes. It still trails the traditional energy fund XLE, but the gap is narrowing.
Oil Moves, Clean Energy Joins
When crude oil spikes, investors often look for related opportunities. Clean‑energy ETFs tend to rise shortly after oil rallies because the whole energy sector gets a boost.
Technical Outlook for ICLN
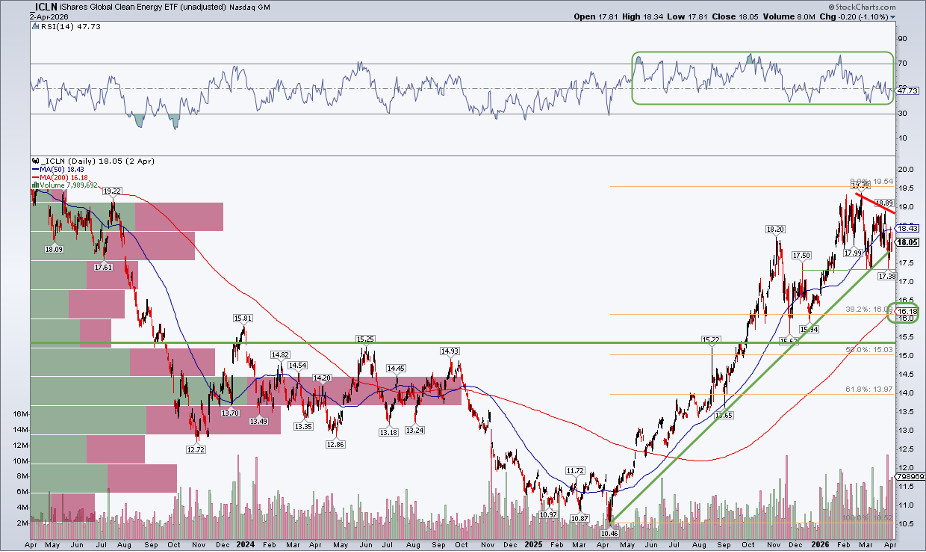
ICLN’s price is forming a classic bull‑flag shape. The fund is holding above a support zone near $17 and above the 200‑day moving average, which sits just above $16. A break above $19.40 could trigger a fresh run higher. Watch the $15‑$15.50 area for longer‑term support.
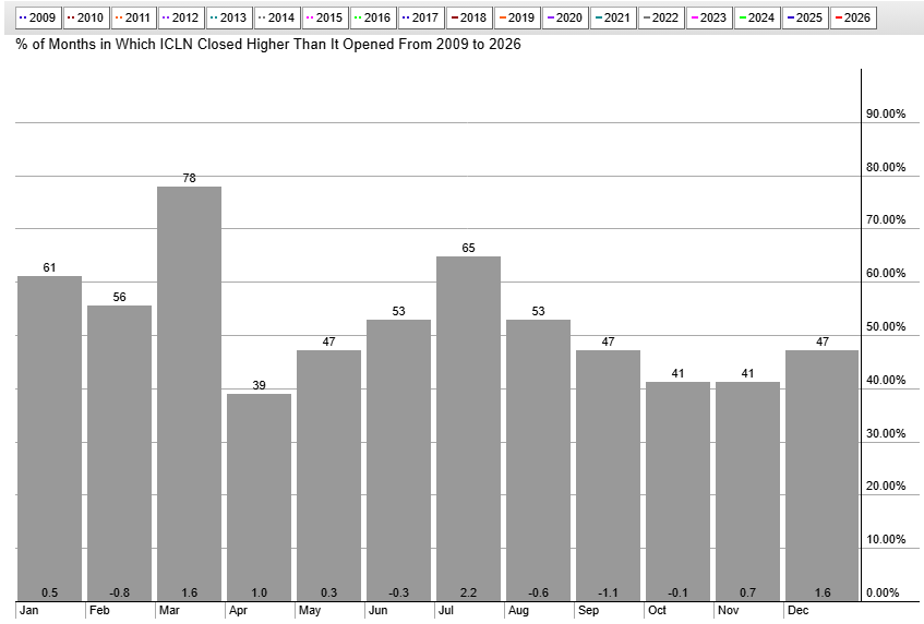
Historically, March and April are strong months for clean‑energy stocks. Since 2009 the sector has shown a pattern of buying in early spring and continuing through mid‑year.
Key Holdings to Watch
ICLN’s biggest components are NextEra Energy (NXT), Bloom Energy (BE) and First Solar (FSLR). Earnings reports from these companies can move the whole ETF, so keep an eye on their quarterly results.
Other Clean‑Energy ETFs
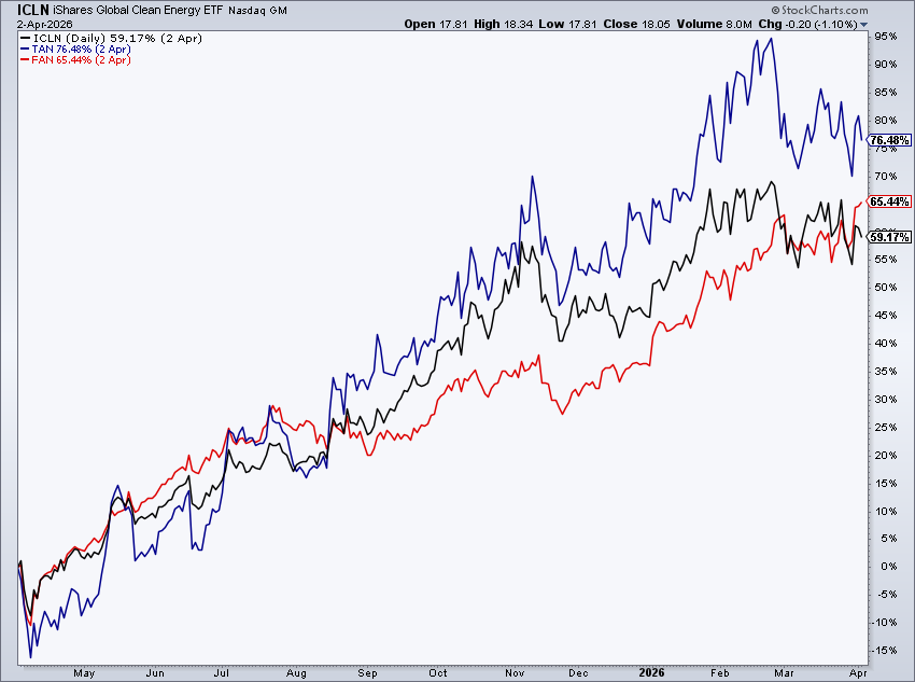
Two more funds give a clearer view of the sector’s strength: the Invesco Solar ETF (TAN) and the First Trust Global Wind Energy ETF (FAN). All three ETFs have posted 60‑75 % returns this year.
FAN is small but aggressive. It is heavily weighted in utilities and non‑U.S. stocks, and it has more than doubled from its 2025 low. The RSI indicator stays above 40, confirming bullish momentum.
What Drives the Rally?
Clean‑energy ETFs have outperformed the S&P 500 for many quarters, not just in 2026. The sector benefits from higher oil prices, supportive policies, and growing interest in renewable technologies such as solar, wind, and battery storage.
Bottom Line
Energy is the main theme in global equities right now, and clean energy is a fast‑growing piece of that puzzle. With oil prices steady and technical charts looking strong, more upside could be on the horizon for solar, wind and storage stocks.
Disclaimer: This article is for educational purposes only and does not constitute financial advice.
Source: Materials provided by https://articles.stockcharts.com.Note: Content may be edited for style and length.