

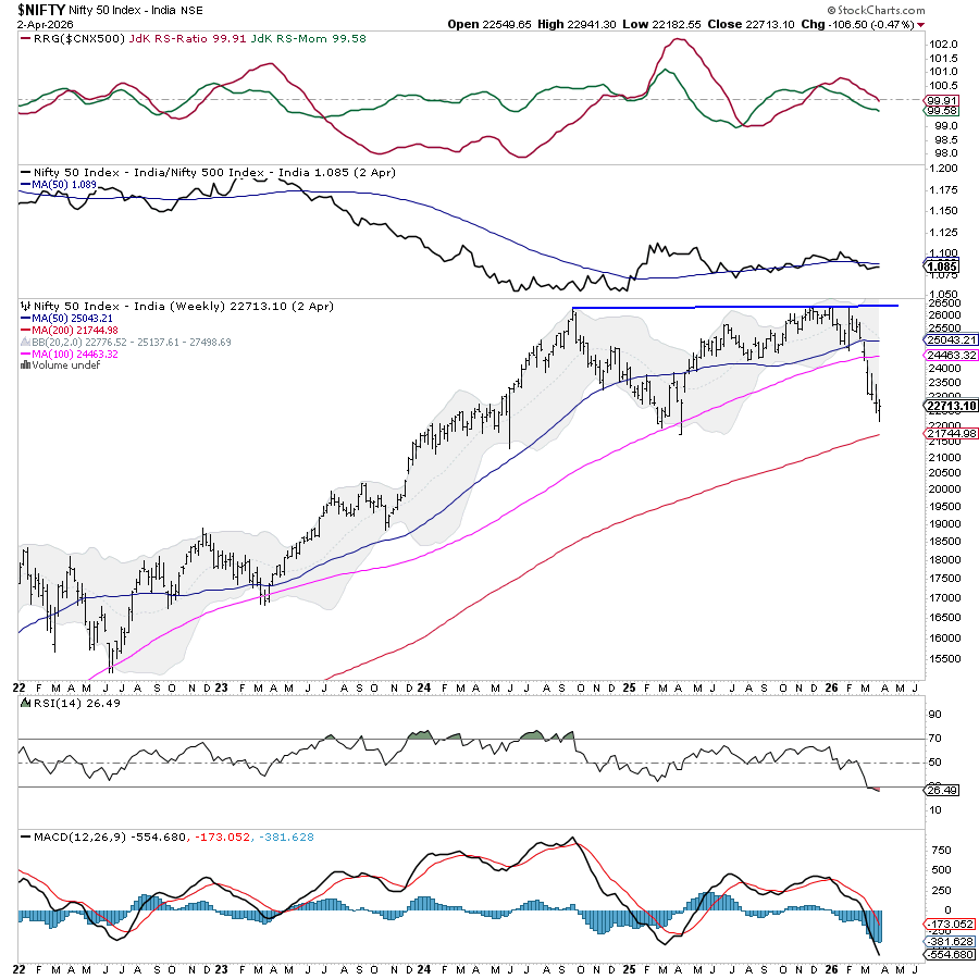
The market moved down most of the short week. Sellers stayed in control and the index closed a little lower. After trying to hold higher prices early on, Nifty 50 drifted down, broke short‑term supports and finished near the bottom of a 758‑point range. The India VIX fell about 5%, showing a calmer but still nervous market. Overall, Nifty lost 106.5 points, or 0.47%.
Technically, the index broke an important support zone and fell below its recent base. It is now trading under the 50‑week and 100‑week moving averages and is heading toward a key support around 21,700 – the 200‑week average. This level is a big checkpoint for the next move.
The broader trend is still flat, so a small bounce could happen if a trigger appears. However, if the price slips past 21,700, a longer correction may follow. Ongoing worries about Middle‑East tensions and higher oil prices keep sentiment fragile, though Indian stocks may still beat other markets.
Next week will likely start cautiously with a downside tone. Immediate resistance sits at 23,000 and 23,250. Support levels are at 22,480 and 22,000. Falling below 22,000 would raise the chance of testing the 21,700 zone soon.
The weekly Relative Strength Index (RSI) is 26.5, placing it in oversold territory. It made a new 14‑day low but shows no clear divergence from price. The MACD stays below its signal line, confirming the bearish momentum.
Price is now hugging the lower Bollinger Band and remains under the 50‑week and 100‑week averages. The long‑term shape stays intact as long as the 200‑week line around 21,700 holds, but short‑term damage is clear.
For traders, a defensive stance is wise. Hold off on new aggressive buys until the market shows stability near key supports. Focus on protecting any gains and pick stocks carefully. Use pull‑backs toward resistance to trim positions rather than open new ones. Keep a close eye on the 21,700 support area.
Sector Outlook for Next Week
We looked at Relative Rotation Graphs (RRG) to compare sector strength against the CNX500, which covers about 95% of the market’s free‑float value.
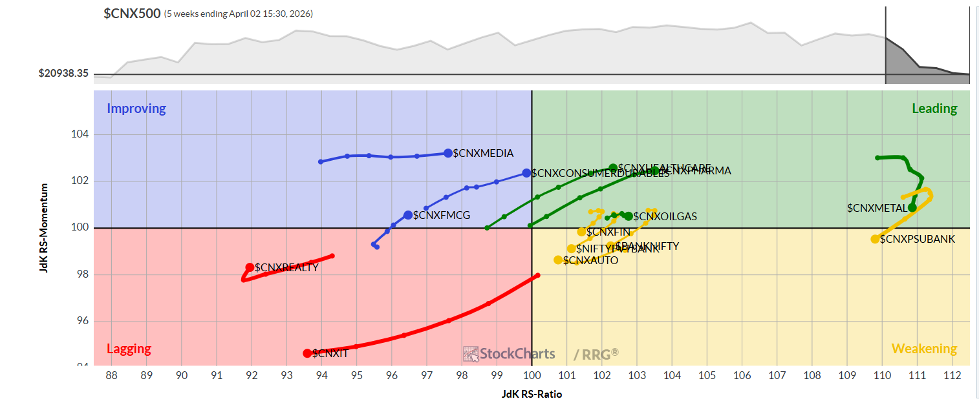
Pharma, public‑sector enterprises, infrastructure, metal and energy groups sit in the leading quadrant, meaning they may beat the broader market. The Mid‑Cap 100 also moved into this leading zone.
The overall CNX500 index is in the weakening quadrant, as are auto, PSU banks and the main bank index. These groups may lag behind the market.
Services and IT are in the lagging quadrant, suggesting possible under‑performance. Real estate is also lagging but shows signs of improving momentum.
FMCG and media sectors are in the improving quadrant, so they might see a modest lift relative to the market.
Note: RRG charts display relative strength and momentum. They are not direct buy or sell signals.
Source: Materials provided by https://articles.stockcharts.com.Note: Content may be edited for style and length.