
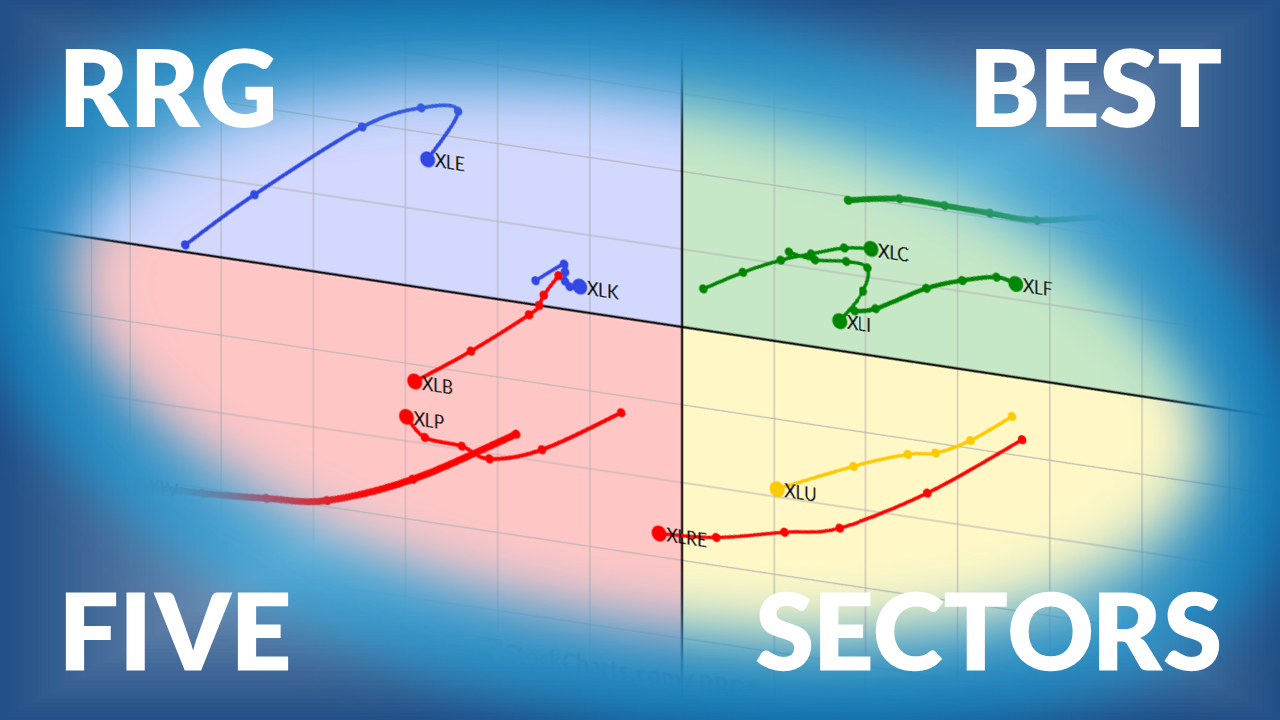
Energy Leads, Heavyweights Lag
By the close of last week the mix of the five strongest and six weakest sectors stayed the same, but the order shifted enough to catch the eye.
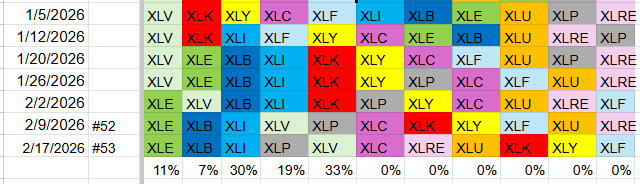
The energy sector still sits at the top, followed by materials and industrials in second and third place. Consumer staples edged up to fourth, nudging healthcare down to fifth. Communication services held steady in sixth.
These weightings highlight the drivers behind recent performance: industrials now represent roughly 30 % of the portfolio, while healthcare accounts for about 33 %.
- Energy (XLE) – 11 %
- Materials (XLB) – 7 %
- Industrials (XLI) – 30 %
- Consumer Staples (XLP) – 19 %
- Health Care (XLV) – 33 %
- Communication Services (XLC)
- Real Estate (XLRE)
- Utilities (XLU)
- Technology (XLK)
- Consumer Discretionary (XLY)
- Financials (XLF)
The Weekly Relative Rotation Graph
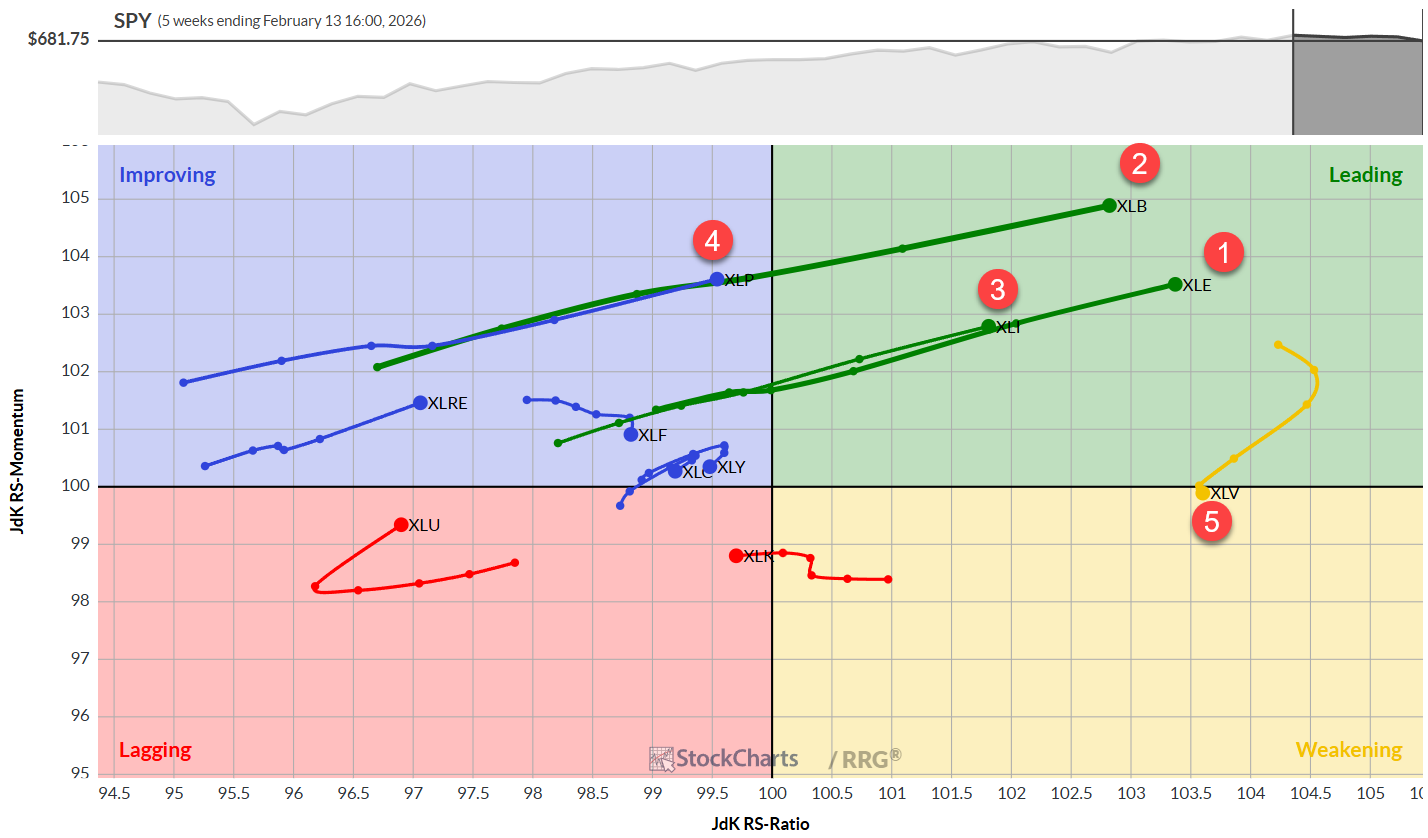
On the weekly RRG, energy, materials and industrials stretch deep into the leading quadrant, signaling robust momentum. Consumer staples is closing the gap and is on the brink of joining the leaders, while healthcare has slipped toward the weakening zone, though it still scores the highest RS‑ratio for the week.
The Daily Relative Rotation Graph
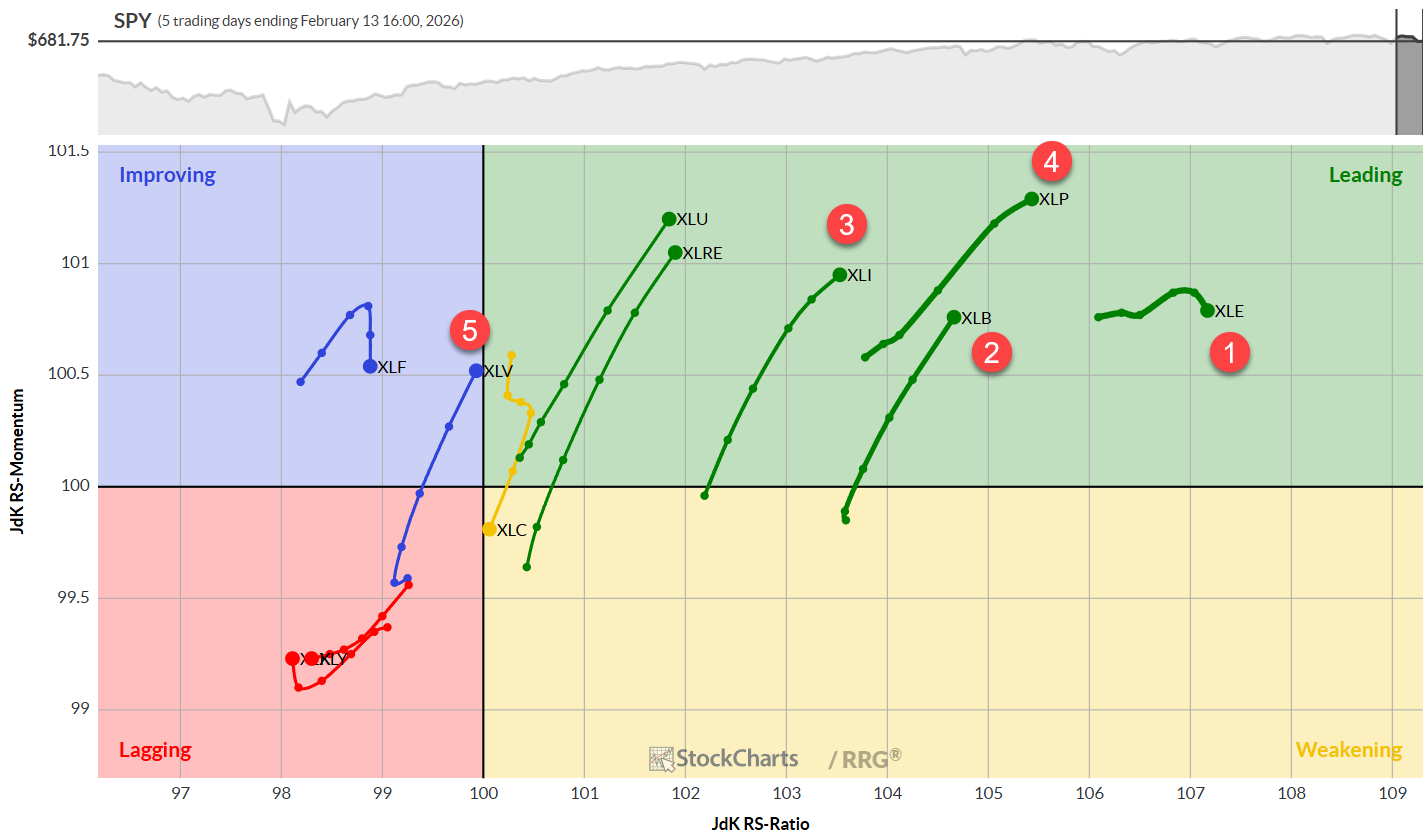
Switching to the daily view, energy remains the strongest RS‑ratio holder but shows a modest loss of relative thrust. Materials, industrials and consumer staples all sit comfortably in the leading quadrant with upward trajectories. Healthcare, now fifth in the portfolio, is climbing through the improvement zone and may soon break into the leaders.
Overall, the top five sectors are posting positive trends on both weekly and daily charts, except for a slight weakening in healthcare on the weekly frame and a gentle slowdown in energy on the daily frame. The majority of sectors sit on the positive side of the RRG, indicating broader market participation.
Heavyweights Dragging the Market
Despite the widening participation, the traditional heavyweight groups—technology, consumer discretionary, financials and communication services—are still lagging the S&P 500. Their underperformance creates a drag on the broader index and raises the question of whether the rally in the lighter‑weight sectors can keep the market moving higher.
Sector Highlights
Energy
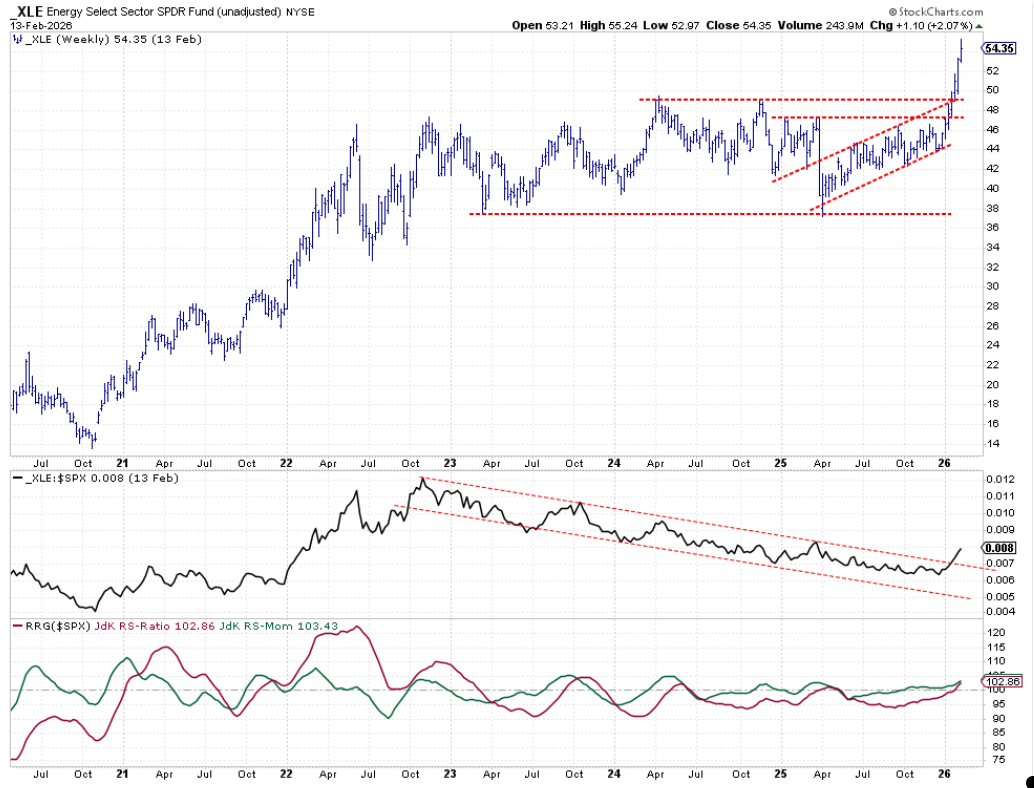
Energy has posted another week of fresh all‑time highs, breaking out of a long‑term down‑trend channel and adding fresh relative strength.
Materials
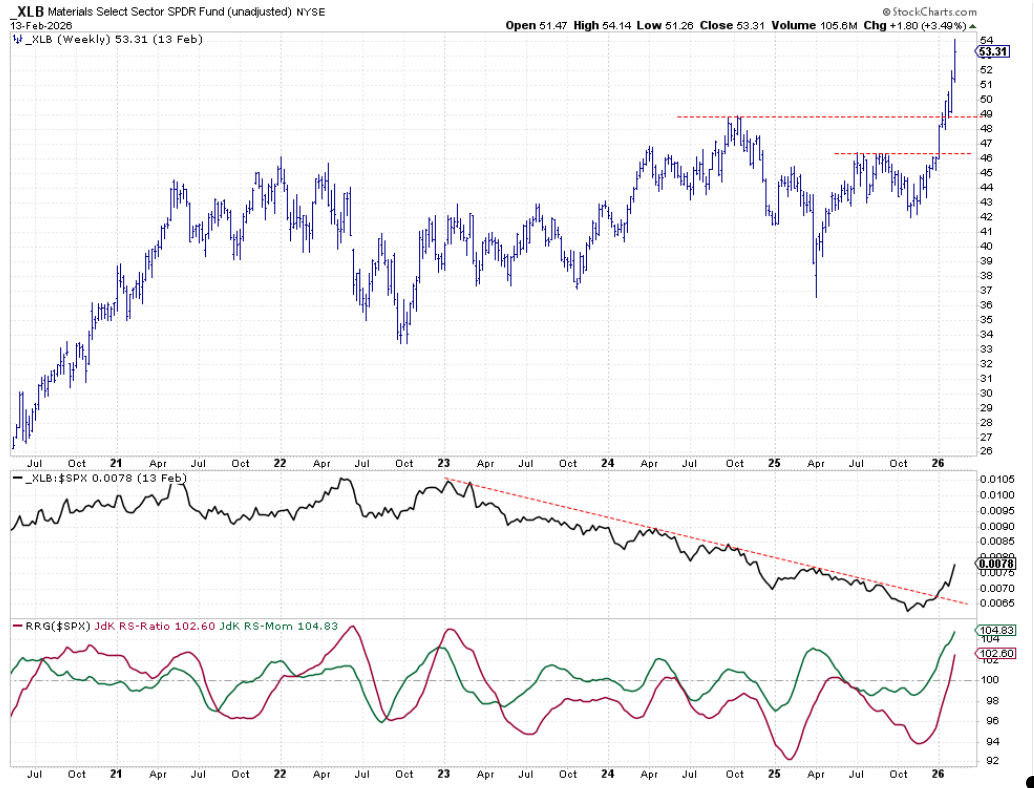
Materials is mirroring energy’s rally, having burst above the 40‑point resistance line and escaping the down‑trend that began in 2023.
Industrials
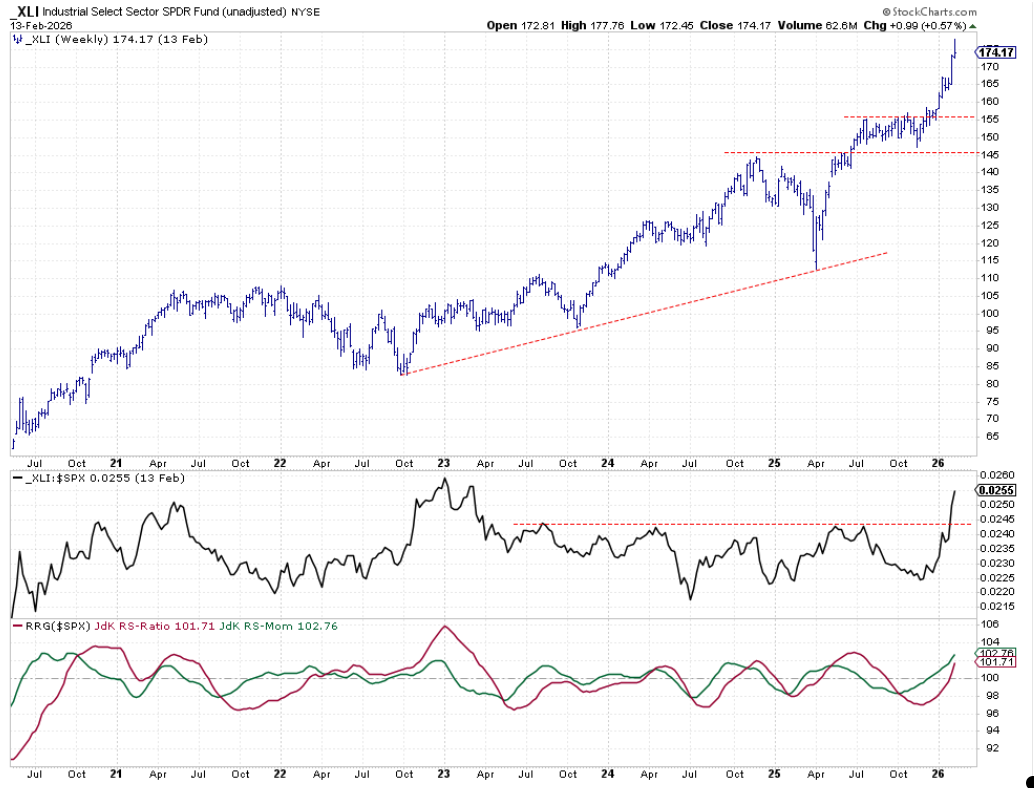
Industrials kept its upward thrust after breaking the 155‑point barrier earlier this year, with its RS line catching up to historic resistance levels not seen since late‑2023.
Consumer Staples
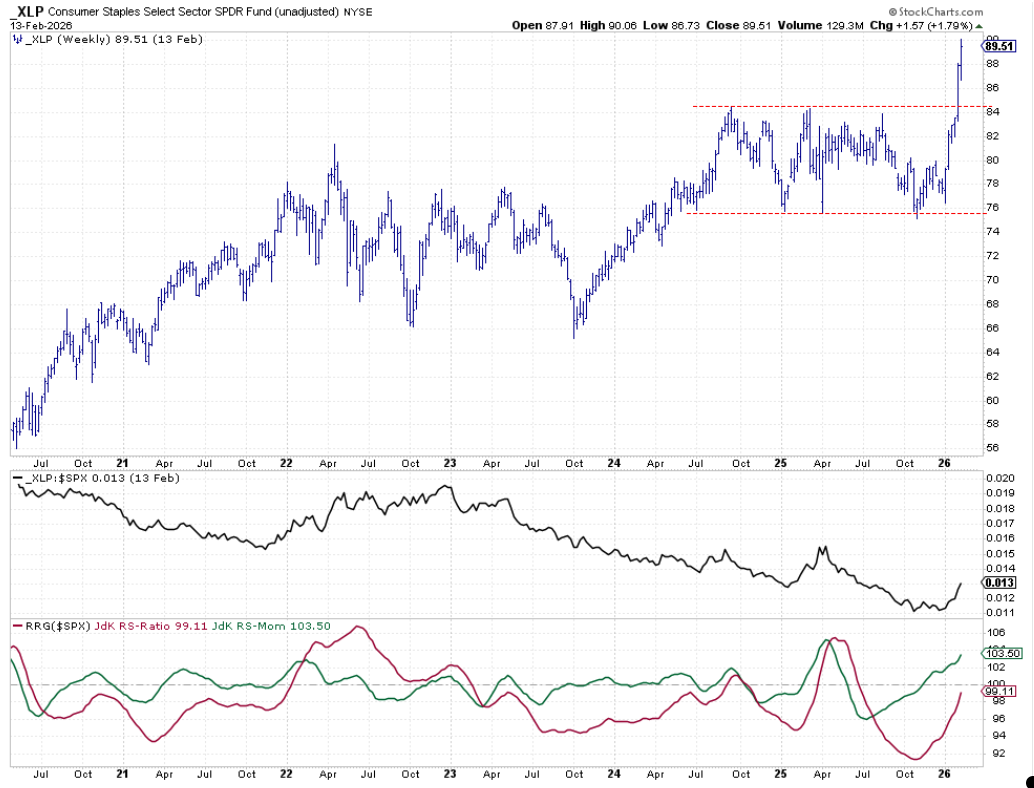
Consumer staples broke through a key resistance zone last week and is now trading near $90, after clearing $84. The RS line is improving, though a higher low is needed to lock in a sustained uptrend.
Healthcare
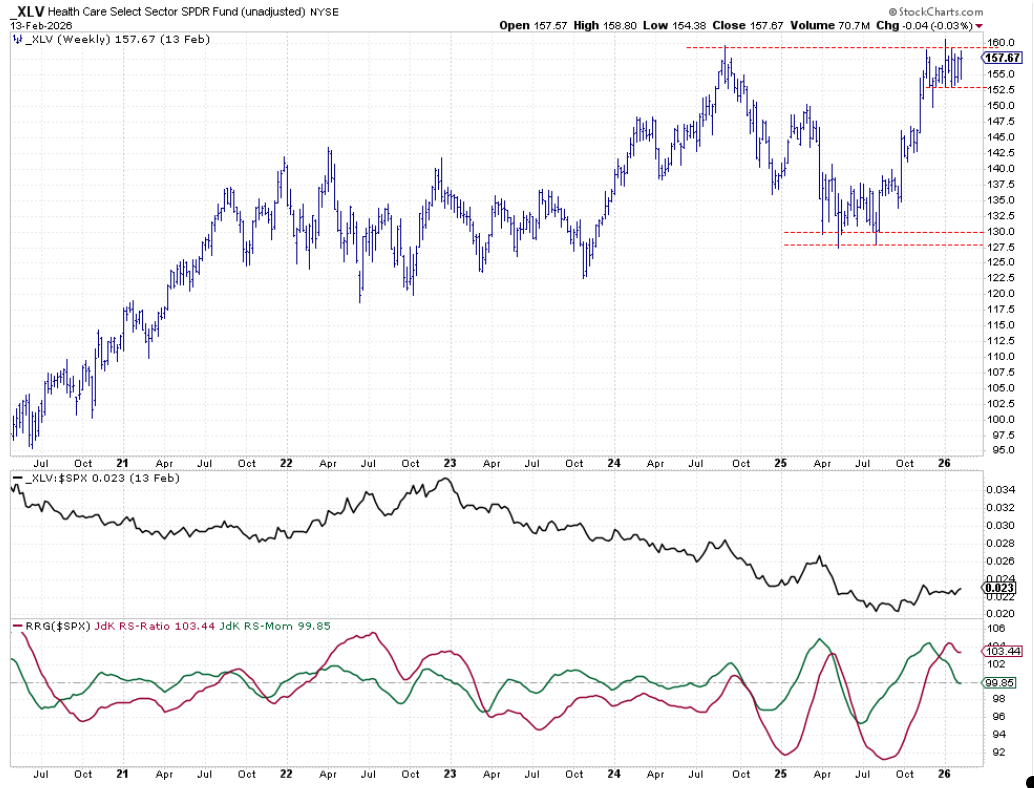
Healthcare remains the only top‑five sector still confined below its 158‑160 resistance band. A modest trading range is forming, and while the RS‑ratio stays above 100, momentum is tapering.
Performance Overview
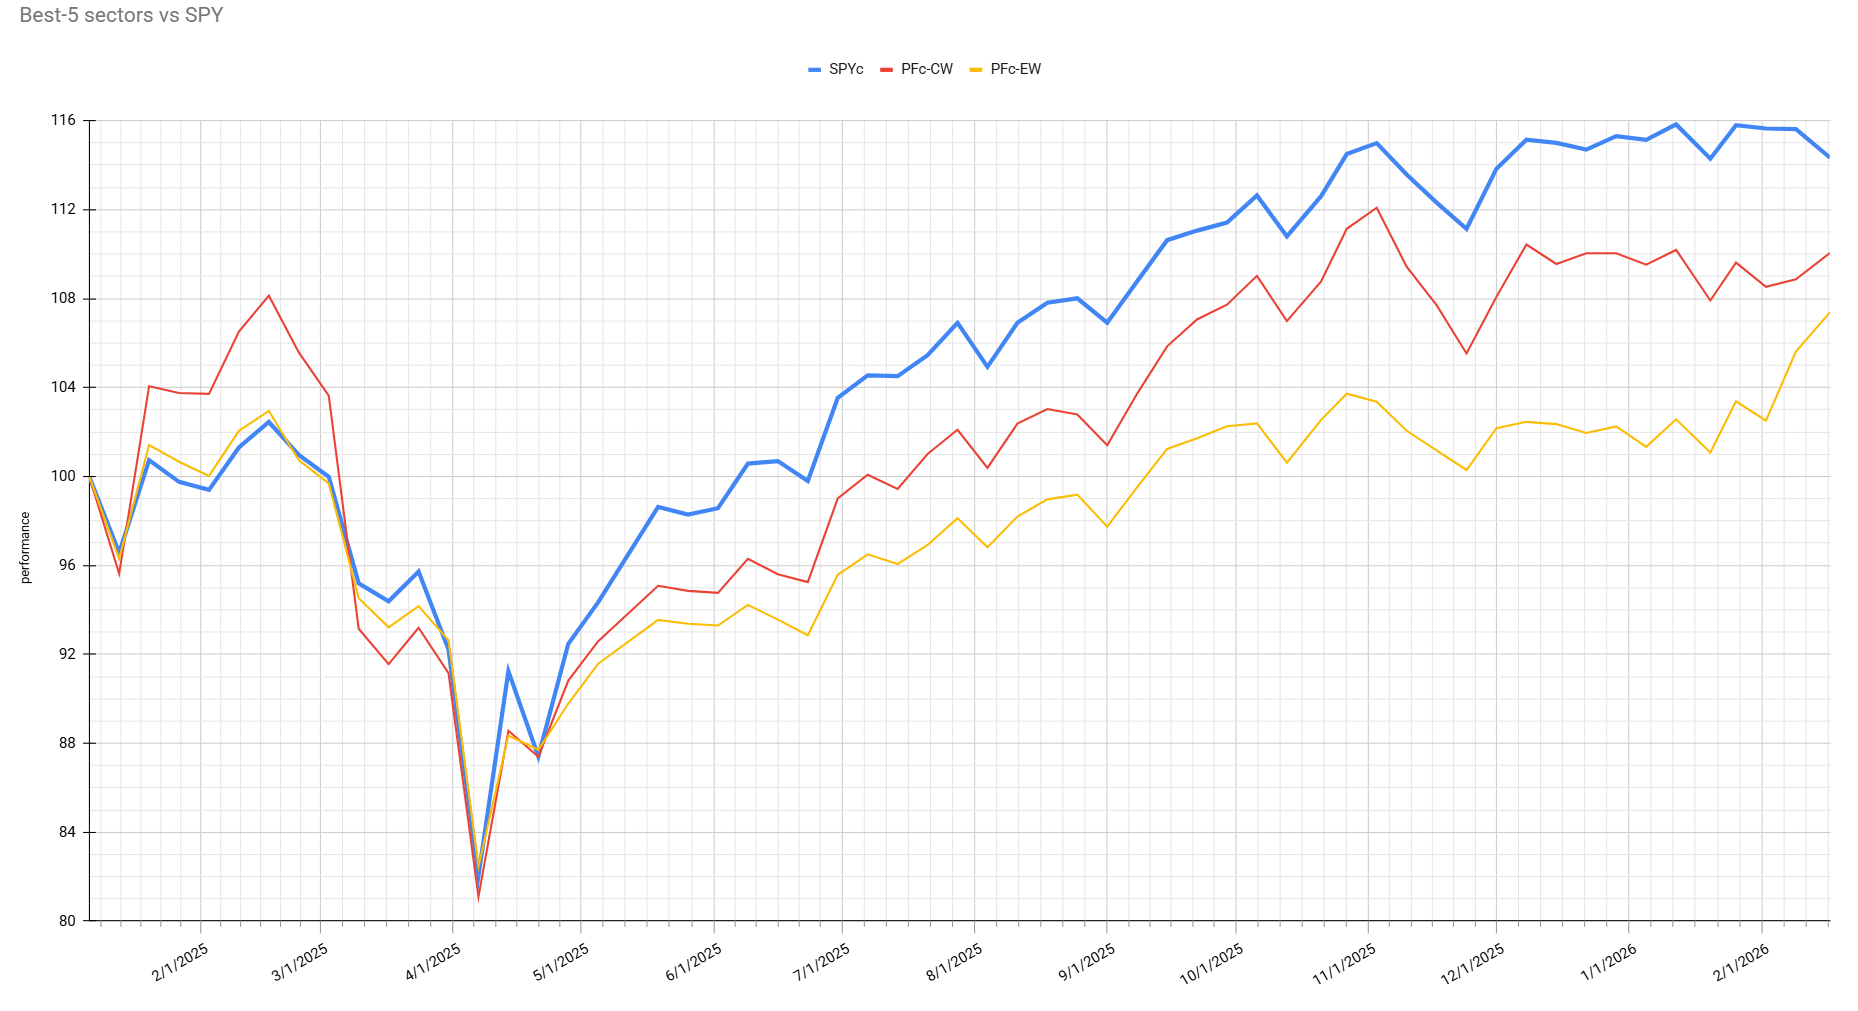
The chart compares the S&P 500 (blue) with a market‑cap‑weighted basket (red) and an equal‑weight basket (yellow). The equal‑weight portfolio surged last week, while the cap‑weighted version also improved even as the S&P 500 slipped.
Because heavyweight sectors are absent from the top five, more capital has rotated into the lighter sectors, narrowing the gap between the cap‑weighted portfolio and the S&P 500 to just over 4 %. The equal‑weight basket, though still trailing by about 7 %, has recovered roughly 7 % since the start of the year.
Conclusion
Sector rotation is now dominated by energy, materials and industrials, while classic heavyweights such as tech and finance lag behind. The widening involvement of mid‑cap sectors is helping diversified portfolios close the distance to the S&P 500, but the sustainability of that momentum depends on whether the underperforming heavyweights can be coaxed back into the rally.
Source: Materials provided by https://articles.stockcharts.com.Note: Content may be edited for style and length.