

Before we jump in…
Many traders write off Ichimoku because it looks complex or feels sluggish. The common mistake is trying to force fast signals or squeezing it onto minute charts. One of the most reliable and straightforward approaches is the Kijun‑sen pullback, which rewards patience and a bit of finesse.
The Core Concept: Trade Around an Equilibrium Line
The Kijun‑sen is essentially the midpoint of the last 26 periods—a moving “fair‑value” reference that updates daily. When a strong trend is in place, price typically drifts away from this line, but during a pullback it often rebounds near the Kijun‑sen before the trend resumes.
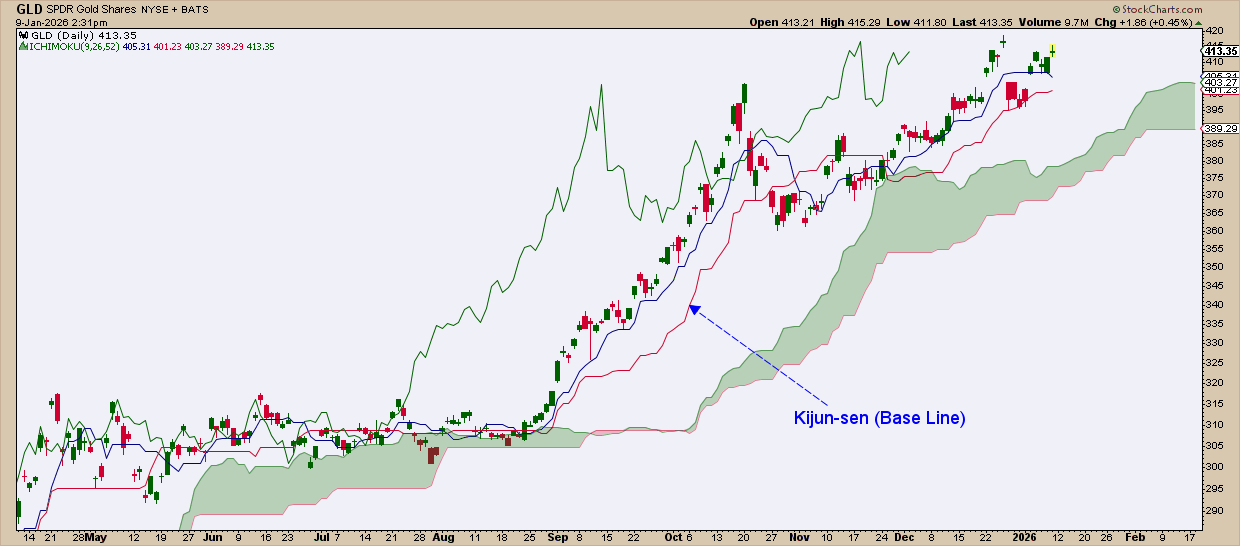
Think of the Kijun‑sen as a balance point. When price pulls back, it tends to test this level, offering a repeatable entry moment if the broader trend stays intact.
Three Simple Steps to Trade the Pullback
Step 1 – Verify the Overall Trend (Non‑Negotiable)
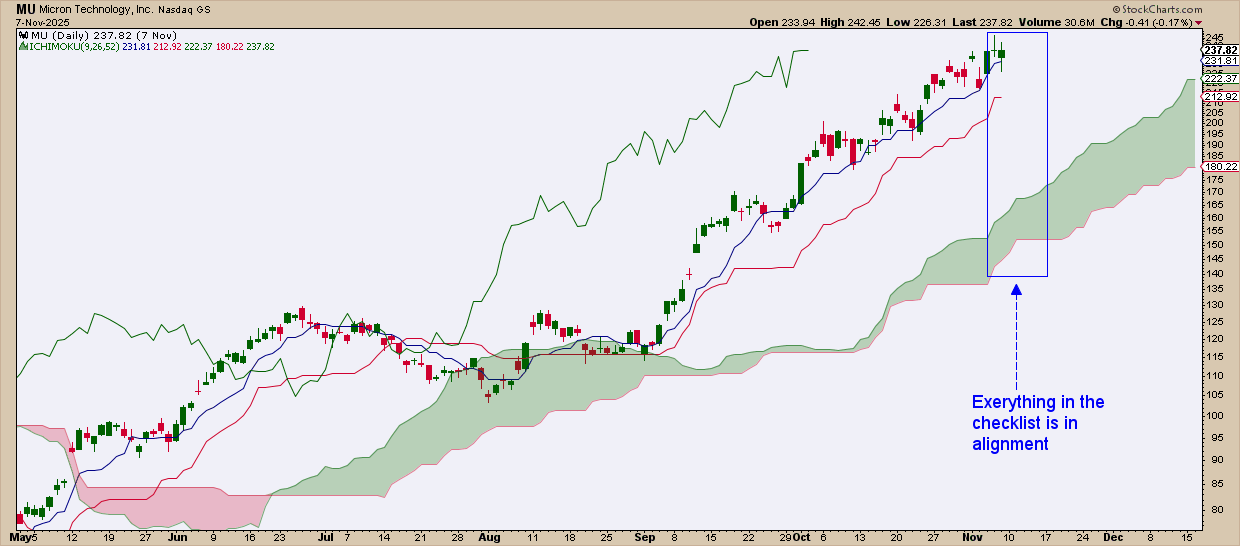
Before you even glance at a potential entry, confirm that the Ichimoku cloud is signaling a bullish environment. A quick checklist helps:
- Price sits above the cloud.
- The cloud is rising and reasonably thick.
- Projected future cloud remains bullish.
- Kijun‑sen slopes upward.
- Chikou‑span sits above past price action.
If the cloud looks flat, thin, or sideways, it’s wiser to stay out.
Step 2 – Wait for a Controlled Pullback (The Hard Part)
Once the trend checklist is satisfied, sit tight until price retreats toward the Kijun‑sen. Look for:
- A measured retracement rather than a sharp dive.
- No decisive close below the cloud.
- The Kijun‑sen acting as a dynamic support zone.
Avoid setups that show:
- Vertical, panic‑selling moves.
- A flat Kijun‑sen that indicates consolidation.
- Chikou‑span tangled with past price.
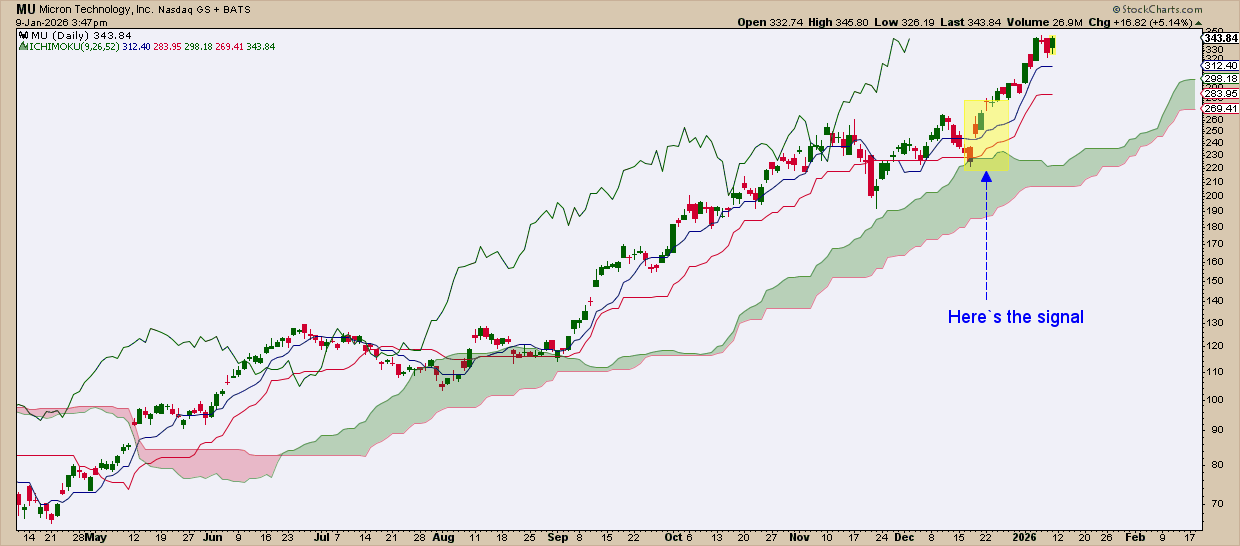
In the MU example, the cloud stayed thick and bullish through November, but it wasn’t until late December that the Chikou‑span cleared past price and the Kijun‑sen lifted off a long flat stretch. The price tested the cloud, got rejected, and the yellow highlight marks the moment all bullish criteria converged.
Step 3 – Enter on Rejection, Not on Touch
The crucial mistake many make is buying the moment price touches the Kijun‑sen. Instead, wait for a clear bounce back above the line. Common entry triggers include:
- A bullish candle closing above the Kijun‑sen.
- A strong rejection off the line followed by continuation.
- Momentum resuming after a brief pierce of the Kijun‑sen.
In short, let the market confirm the reaction before you act.
Where to Place Your Stop
The Kijun‑sen offers a natural reference, but a tighter stop just below it can be vulnerable to normal pullbacks. A more robust approach is to anchor the stop at the most recent swing low while also considering the cloud’s lower boundary.
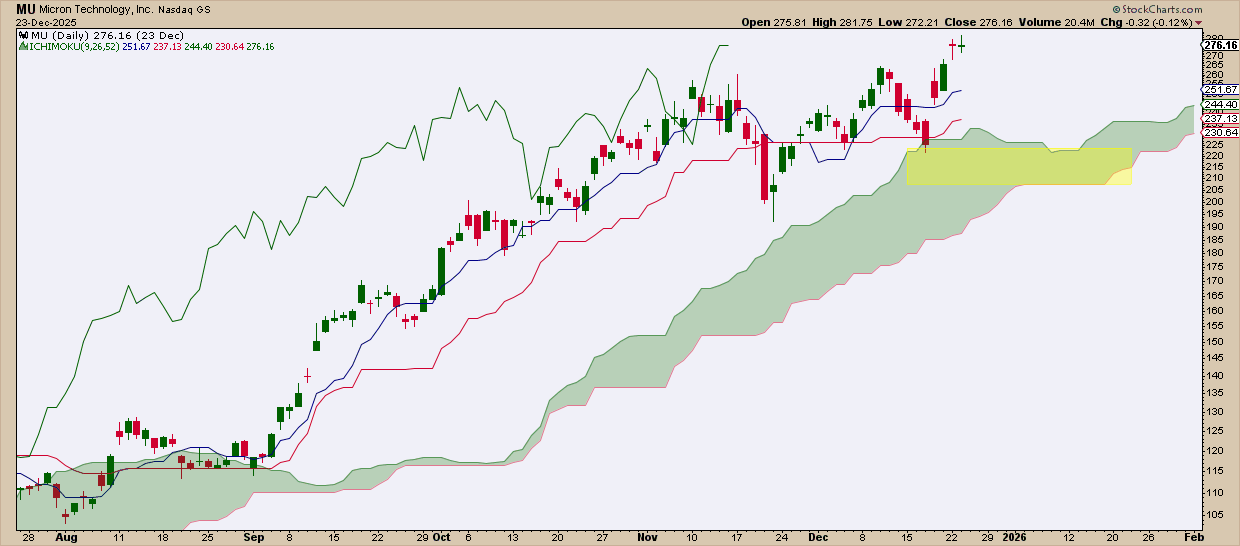
In this case, the swing low provided a logical stop zone, while the cloud offered an extra cushion of support. Different traders may choose slightly different levels, but the principle remains the same: protect the trade without getting knocked out by routine retracements.
Insider Tip: Distinguish Stop‑Losses from Trend Exits
One of the biggest pitfalls is exiting too early. Let the trend breathe, but be ready for genuine exit signals. Early warnings (not exits) are:
- Tenkan‑sen crossing below Kijun‑sen.
- Price closing just beneath Kijun‑sen then recovering.
- Chikou‑span moving toward past price.
The primary exit signal is a clean close below the cloud confirmed by the Chikou‑span, indicating a possible regime shift rather than a short‑term pause.
Final Thoughts
The Kijun‑sen pullback is a patient, low‑noise strategy that works best in strong trends. It gives you multiple chances to join the move without chasing price. Respect the equilibrium line, follow the three‑step process, and adjust stops and exits with the market’s context for consistent results.
Source: Materials provided by https://articles.stockcharts.com.Note: Content may be edited for style and length.