
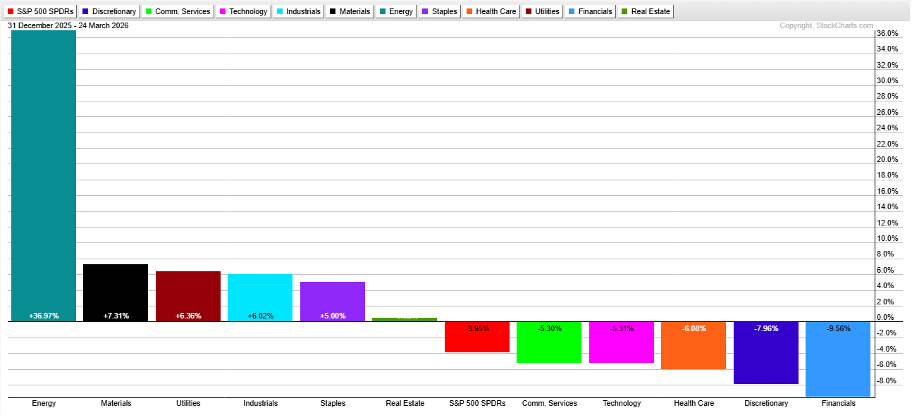
March has been tough for investors. The S&P 500 is about 3% lower for the month. Small‑cap stocks and emerging markets fell even more. But the financial sector might be showing a tiny spark of hope.
Financial stocks (ticker XLF) are down about 10% year‑to‑date, even after counting dividends. They are among the five S&P 500 sector ETFs that have lost value so far.
Many people blame big banks for the slide. They worry about slower growth, private‑credit problems, and new rules that could affect credit‑card companies. Still, the price chart for XLF tells a slightly different story.
Price Moves Hint at a Small Turn
While the overall market has been making lower highs and lower lows, XLF hit a low last Thursday and then rose to a 13‑day high at the start of this week.
Recent comments about reduced tension in the Middle East helped lift futures, and XLF could reach a new short‑term high soon.
When the market is quiet, I like to look at extended‑hours data. Those pre‑market and after‑hours moves can show hidden turning points that many traders miss.
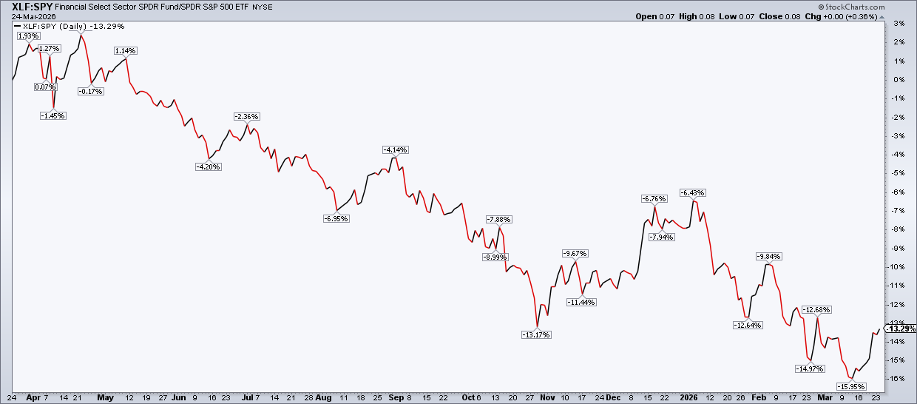
Relative Strength Is Starting to Improve
Comparing XLF to the S&P 500 (SPY) shows a big gap that has narrowed in the last two weeks. Earlier this year, many expected deregulation and strong Main Street activity to lift bank profits, but the price never followed.
Now the gap is closing, suggesting that financial stocks may be finding some footing.
Big banks such as JPMorgan, Bank of America, Wells Fargo, Citigroup, and others are roughly flat for the month. Some private‑credit firms are even seeing a late‑quarter boost.
Regional Banks Show Early Signs of Recovery
Regional bank ETFs have risen about 6% from their March lows. They still face challenges like recession worries and a flattening Treasury curve, but they are holding above a key support level near $58.
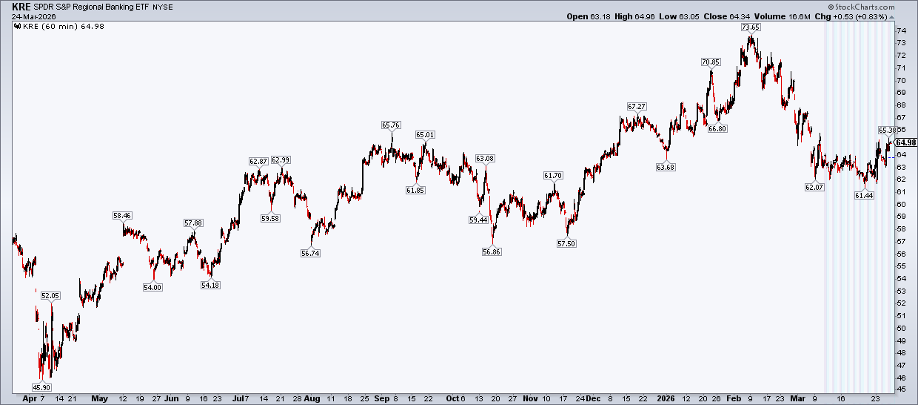
These smaller banks are often early indicators of broader financial health, so their recent strength is encouraging.
Earnings Season May Provide the Next Push
Quarterly earnings are coming up soon. Historically, banks can rally before earnings and then fall back after results are out, even if the numbers look good.
This cycle starts with BlackRock reporting on April 10, followed by Goldman Sachs on April 13, and then the major banks a few days later.
Long‑Term Trend Remains Difficult
Looking at a three‑year view, XLF still faces a bearish pattern. The 50‑day moving average fell below the 200‑day line, and momentum indicators have stayed weak.
Volume data also shows many shares have been traded above today’s price, making it harder for the market to push higher.
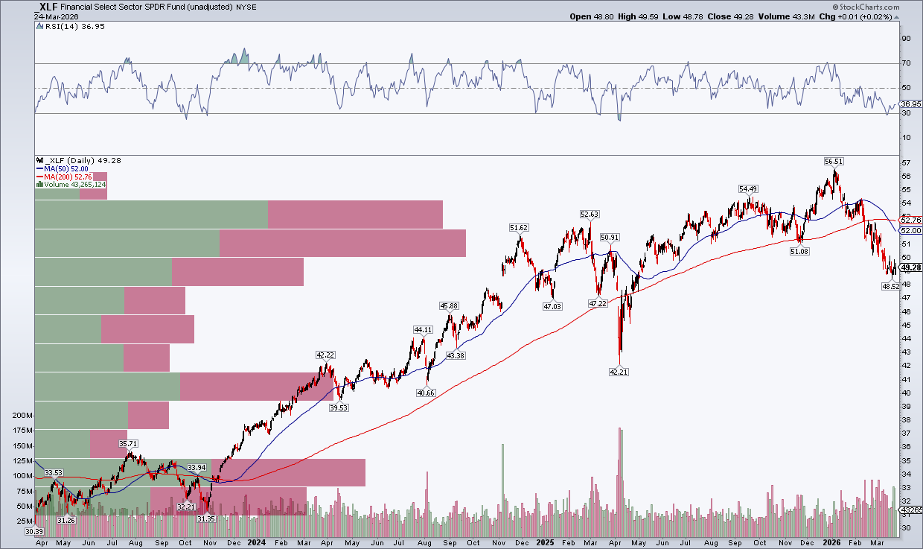
Important price levels to watch are $45 resistance and $42 strong support. A break below $42 could signal a larger decline in the S&P 500.
Bottom Line
Financial sector charts are not overwhelmingly bullish, but short‑term price moves give a reason for optimism. Big banks are holding steady, and regional banks are showing more resilience than many expect.
We will keep an eye on extended‑hour price action and the upcoming earnings reports to see if the sector can keep its upward momentum.
Disclaimer: This content is for educational purposes only and does not constitute financial advice. Always consider your personal situation and consult a professional before making investment decisions.
Source: Materials provided by https://articles.stockcharts.com.Note: Content may be edited for style and length.