
Market Overview
The French CAC 40 index finished the day a little higher, gaining 0.49% to reach 7,974.49 points with a trading volume of €3.66 billion.
Even though the energy situation remains uneasy, the market kept its bounce from the previous session.
Why Oil Is Still Pressured
Oil prices are under stress. The United States asked its allies to help secure the Strait of Hormuz, but Germany declined, and Japan and Australia say they are unlikely to send ships. The United Kingdom and France are still deciding.
U.S. Treasury Secretary Scott Bessent said on CNBC that Iranian tankers may be allowed to move oil to Asian buyers, but the comment did not calm the market.
On Tuesday morning, West Texas Intermediate (WTI) hit $97.63 and Brent $104.97 before slipping to about $94 and $101.6 respectively.
Energy news will be a big part of Fed Chair Jerome Powell’s remarks on Wednesday after the Federal Reserve’s expected hold decision and new economic forecasts.
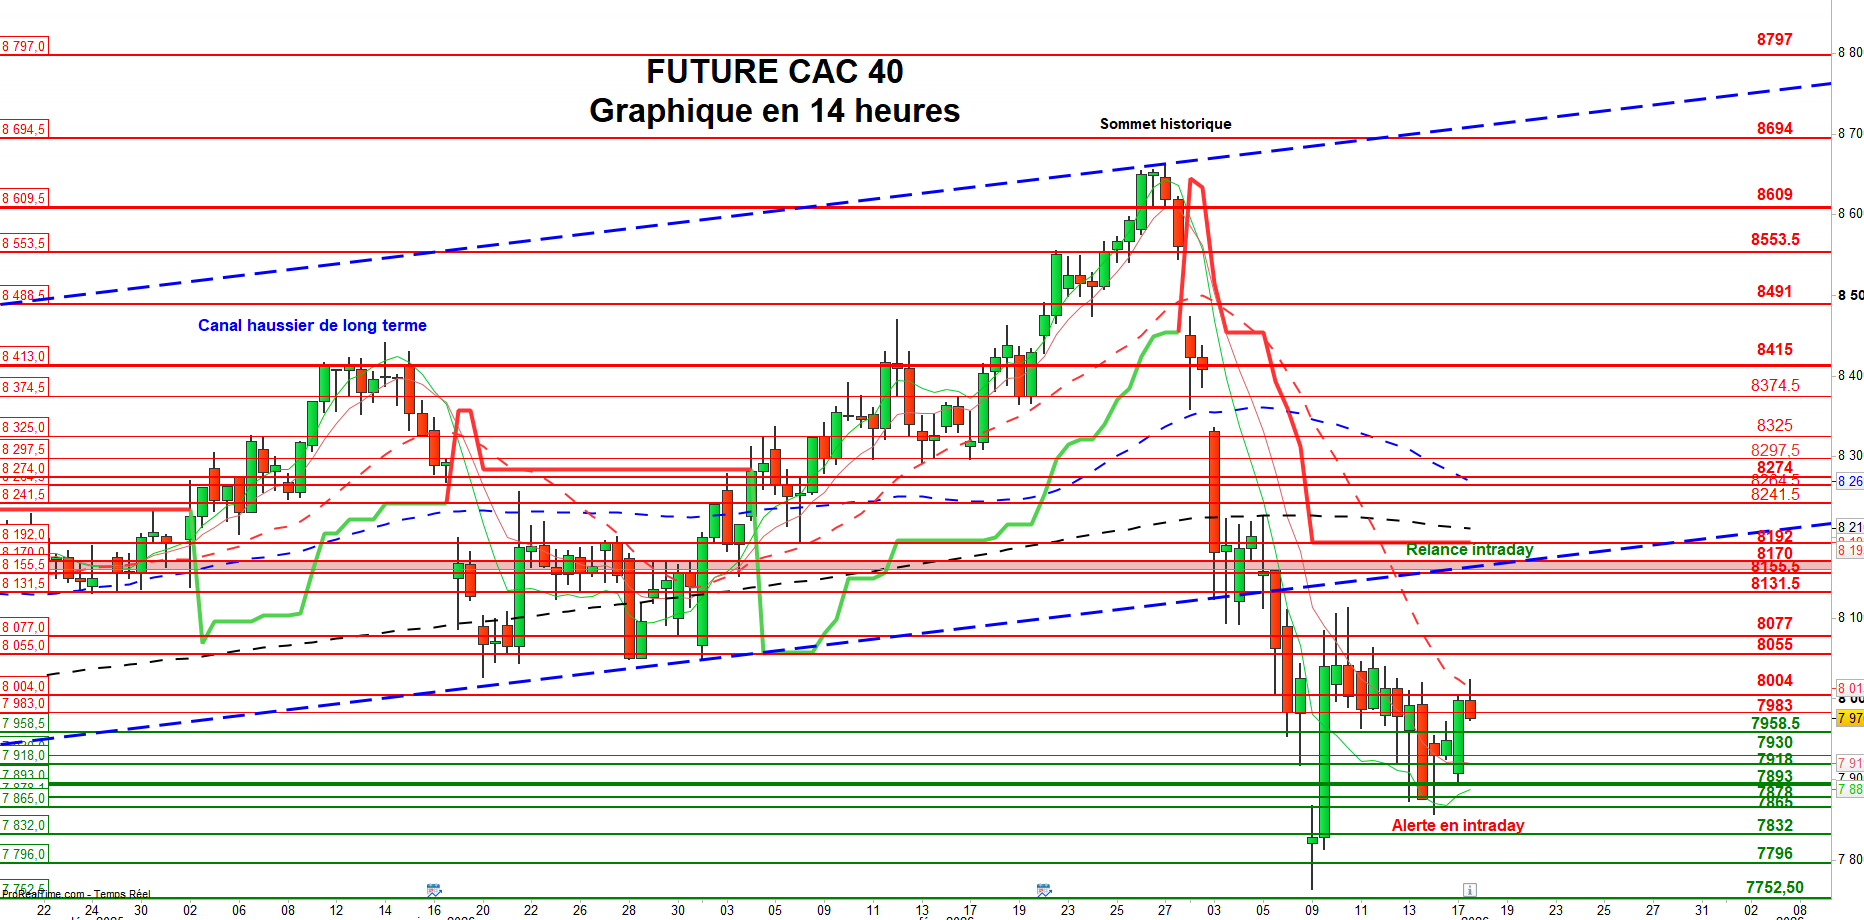
Future Contract Levels (March)
Key resistance points (where price may face upside pressure): 7,990 → 8,048 → 8,077 → 8,099.5 → 8,117 → 8,135 → 8,141.5 → 8,149.5 → 8,171 → 8,249.5 → 8,264.5 → 8,297.5 → 8,326 → 8,353.5 → 8,374.5 → 8,430.5 → 8,563 → 8,688.5 → 8,912 → 8,916 → 9,030 → 9,338.
Key support points (where price may find a floor): 7,958 → 7,924.5 → 7,895.5 → 7,881 → 7,873 → 7,853 → 7,831 → 7,740.5 → 7,615.5 → 7,574 → 7,466.5 → 7,330 → 7,164.
When the index stays above 7,917 points, the short‑term bias is positive.
Technical Picture
The March future has steadied and is trying to build a small rebound. This step is needed before a stronger climb can happen.
Helpful signs include a weaker dollar index, lower U.S. 10‑year yields, and reduced market volatility.
The crucial test is breaking the 20‑period moving average, which sits at about 8,014 points on the 14‑hour chart. The index has been below this line since March 2, after the U.S. and Israel announced coordinated strikes on Iran.
If the price moves above that average, it could signal the start of a more solid rally, especially if it re‑enters the long‑term upward channel that was broken on March 5.
Momentum Indicators
The MACD histogram has turned positive, hinting at a possible bounce. The RSI is also climbing, confirming the upside bias. Trading volume shows a slight increase, suggesting buyers are returning.
On the flip side, falling below 7,930 points would weaken the current momentum. A drop under the March 16 low of 7,856.5 points would be more damaging, and slipping under the March 9 low of 7,764 points could push the index toward the 7,600‑point region.
Conclusion
We keep adding to our dynamic and investor portfolios as chart patterns develop, favoring the bullish scenario. However, we stay cautious and will only increase positions when clear technical targets are reached, staying true to risk‑management rules.