CAC40 Gains 0.31% at Day End
The CAC40 cash index finished the session higher by 0.31%, reaching 7,935.97 points with a total turnover of €3.67 billion.
Paris’ stock market ended the day on a positive note, but investors are still careful. The caution comes from ongoing tensions in the Middle East and the anticipation of key decisions from the world’s biggest central banks.
The U.S. Federal Reserve will speak on Wednesday evening. It is expected to keep its current policy. The European Central Bank meets on Thursday and may warn about inflation that is still high because oil prices stay above $100 per barrel.
Both Jerome Powell and Christine Lagarde will shape how traders view the risk of a stagnant economy combined with rising prices (stagflation). The U.S. economy grew only 0.7% in the fourth quarter, showing a slowdown even before the recent strikes in Iran.
Oil supply is also in the spotlight. While 400 million barrels have been released from strategic reserves, global supply could drop by 8 million barrels per day in March because the Strait of Hormuz is partially blocked.
Because of these factors, the market prefers to wait for clear chart signals before betting on a strong, lasting rally.
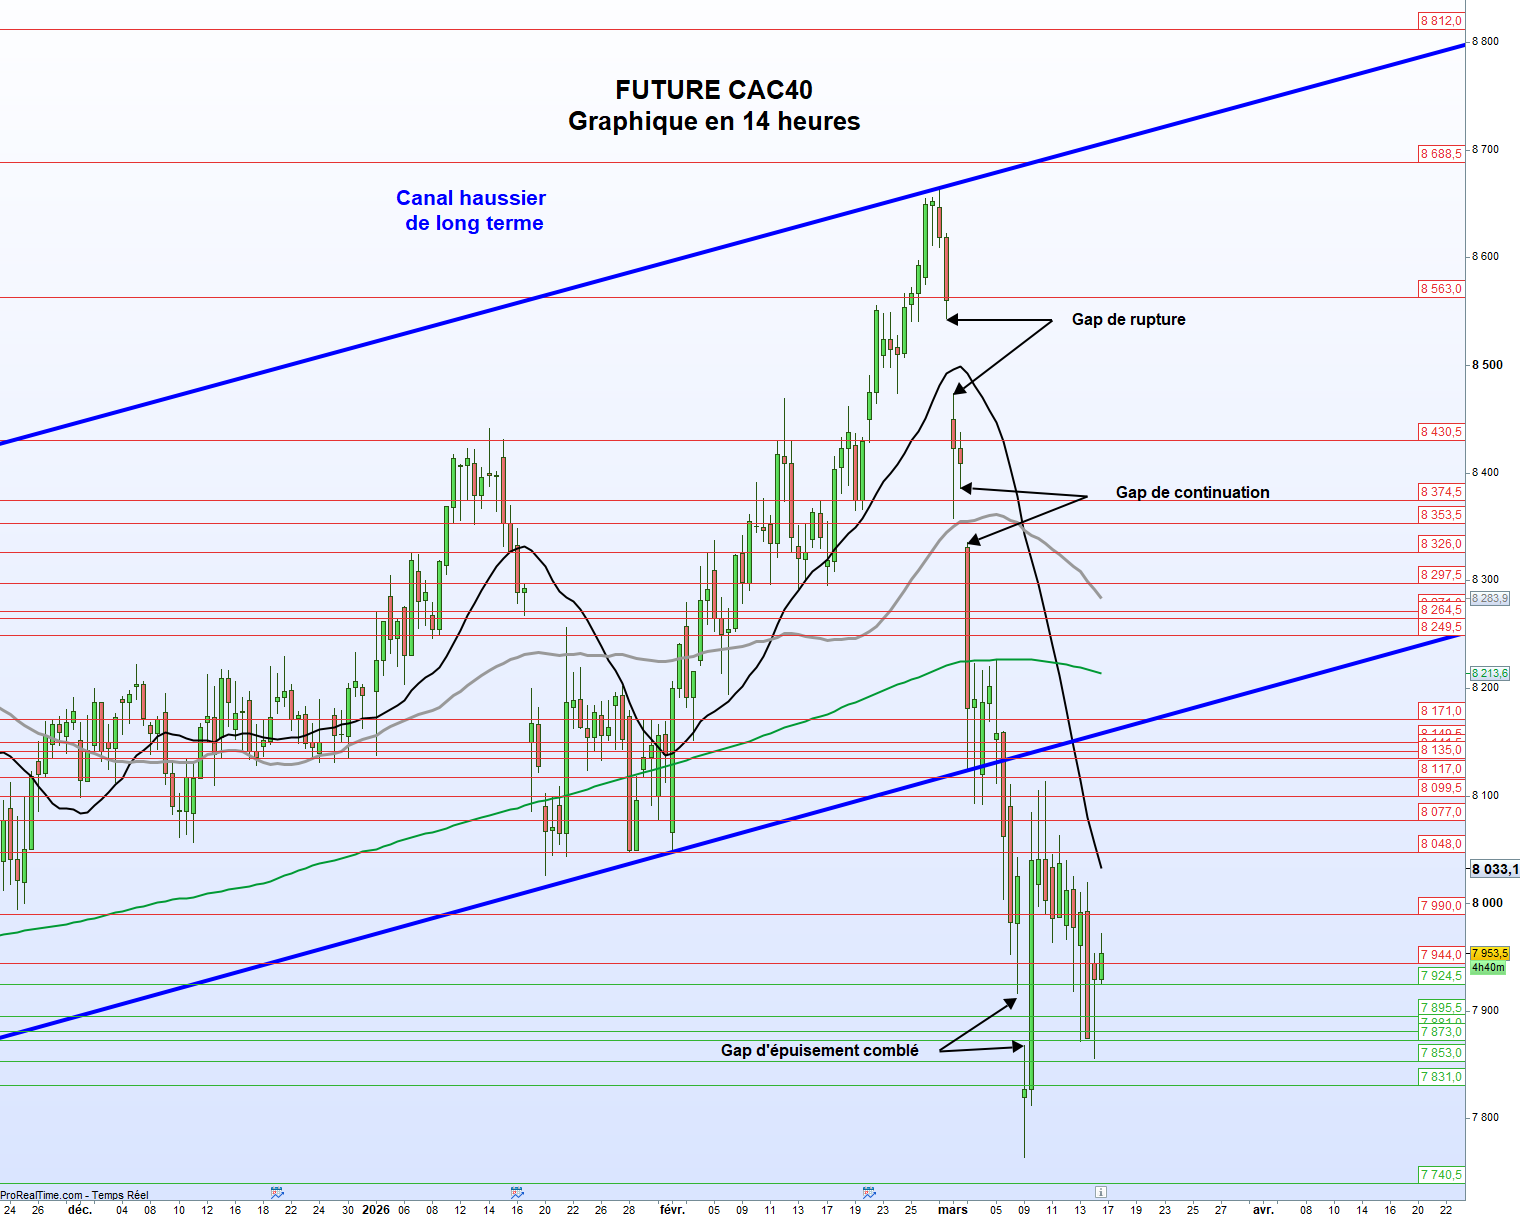
Future CAC40 – March Contract
Key resistance levels (price points where the market may struggle to rise further):
- 7,944 – 7,990 – 8,048 – 8,077 – 8,099 – 8,117 – 8,135 – 8,141.5 – 8,149.5 – 8,171 – 8,250 – 8,264.5 – 8,298 – 8,326 – 8,354 – 8,375 – 8,431 – 8,563 – 8,689 – 8,912 – 9,016 – 9,030 – 9,339
Key support levels (price points where the market may find a floor):
- 7,924.5 – 7,895.5 – 7,881 – 7,873 – 7,853 – 7,831 – 7,740.5 – 7,615.5 – 7,574 – 7,466.5 – 7,330 – 7,164
During the day, the price stayed above 8,160, indicating a short‑term bullish trend.
What the Chart Is Saying
The March future showed a quick “exhaustion gap” that the index filled soon after. Earlier in March, two other gaps appeared: a “breakaway gap” on March 2 and a “continuation gap” on March 3.
As long as the index closes above the 7,831‑point line, the short‑term outlook stays neutral. If the price falls below this line, the market could move toward the 7,600 region, which matches the size of the previous move.
On the flip side, a bounce that pushes the index past 7,990 would show that the market can stay strong. The first target would be around 8,160 points. If the price re‑enters the upward channel, it could finish the consolidation phase and aim for the next open gaps at 8,385.5 and 8,544 points.
A clear break above the top of the channel would erase the weekly “triple‑top” pattern and could restart a strong rally toward 9,338 points, which is the theoretical height based on the recent range.
Conclusion
We keep adding to the Dynamic and Investor portfolios when chart signals appear, favoring the bullish scenario. However, we stay cautious and will only increase positions significantly when the price reaches the predefined chart targets, always respecting risk‑management rules.