
The stock market has been climbing fast, and a dip could happen at any time. The hard part is knowing when it will start.
This week was bumpy. On Tuesday the S&P 500 hit a record high, then fell on Wednesday. Thursday ended strong, giving hope that the up‑trend was still alive. By Friday the mood changed again.
A strong jobs report reminded investors that a solid labor market might push the Federal Reserve to raise rates later this year. Treasury yields rose after the report, adding pressure to an already hot equity market.
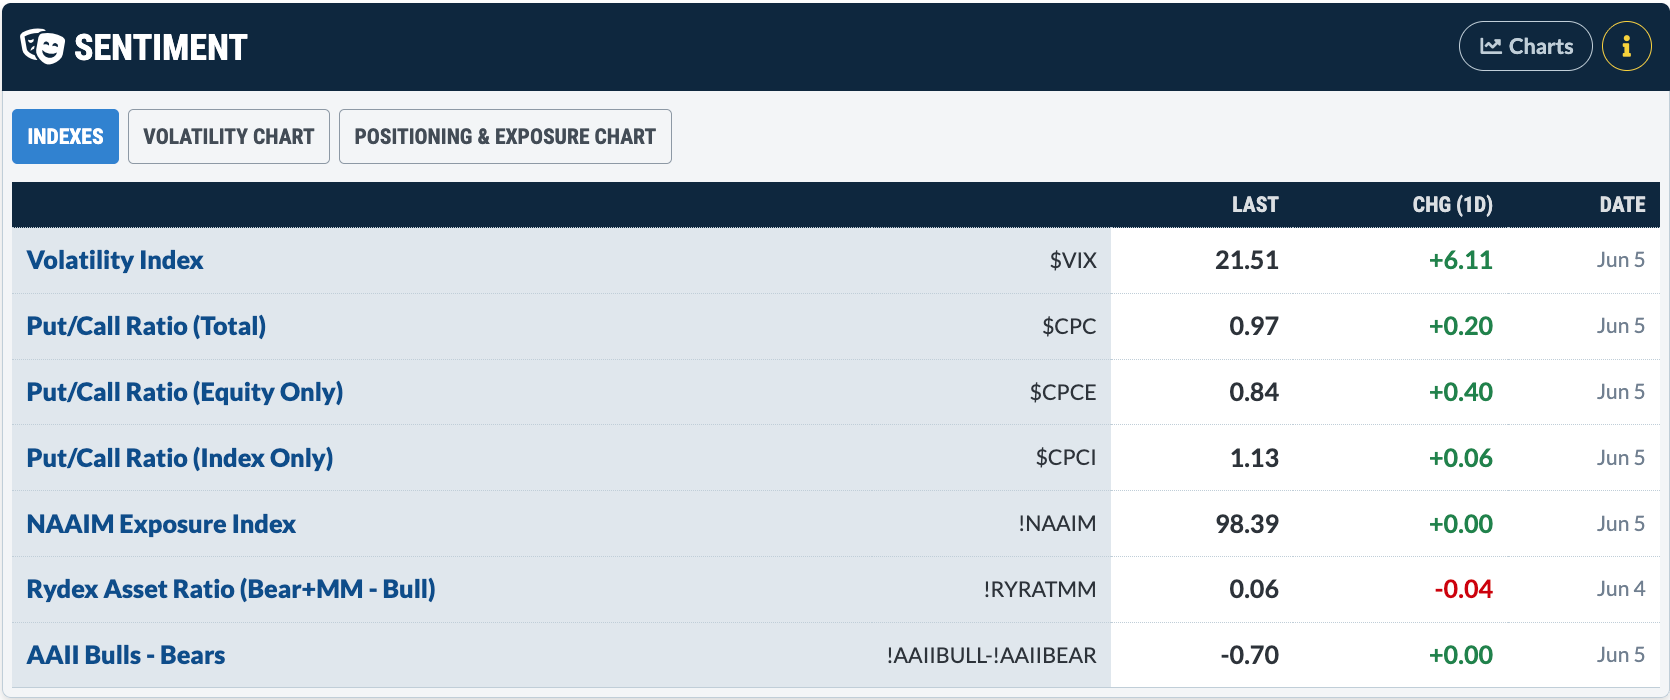
What do the sentiment gauges show? The VIX jumped more than 39% to finish the day at 21.51. It briefly fell, then spiked again at the close. The put‑call ratio also surged about 90%. Those numbers don’t look friendly for bullish traders.
The NAAIM Exposure Index and the AAII Bull‑Bear spread haven’t moved much yet, but a continued sell‑off could make them shift noticeably.
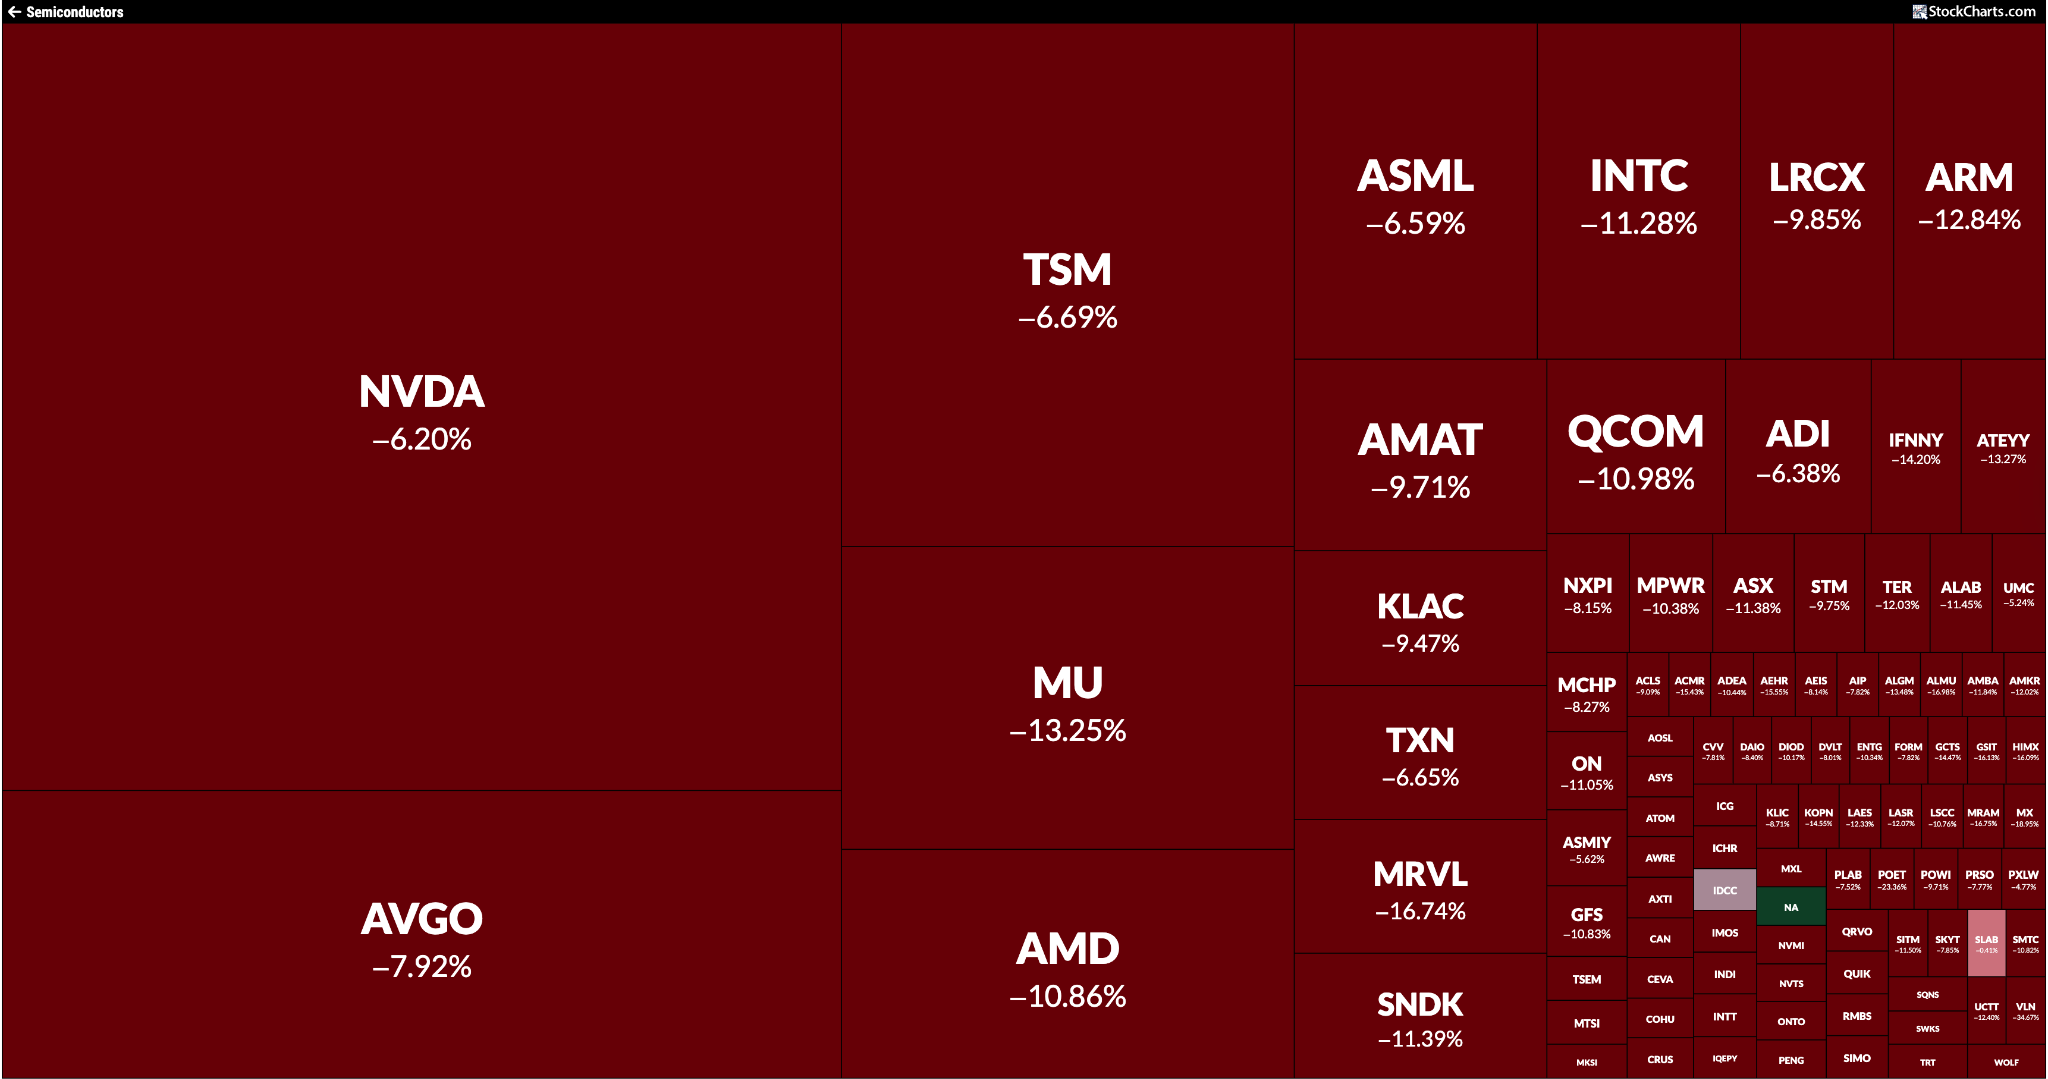
One sector that stood out was semiconductors. The SPDR S&P Semiconductor ETF (XSD) dropped over 11% on Friday. The market‑carpet view of the semiconductor group shows just a tiny green square amid a sea of red.
Stocks weren’t the only losers. Bonds, precious metals and cryptocurrencies also felt the squeeze.
Next week brings key data: the May Consumer Price Index and Producer Price Index. If those numbers come in hotter than expected, investors could get nervous, and the chance of a Fed rate hike would rise, making borrowing more expensive for everyone.
Another big event is the SpaceX IPO, set to start trading on Friday. Will the hype turn into buying power, or will excitement fade once the stock opens? Keep an eye on the intraday charts.
The market feels stretched, so opening new positions is risky. You want to catch upside moves, but you also don’t want to be caught on the wrong side. Stay patient, watch the data, and move only when the picture becomes clearer.
Have a great weekend!
Source: Materials provided by https://articles.stockcharts.com.Note: Content may be edited for style and length.