

Tech Leads but New Sectors Join the Top Five
The S&P 500 jumped more than 3% last week. After the move, the mix of sectors in our portfolio changed a lot. Technology is still the biggest piece, but its share fell from about 70% to roughly 50% as other sectors grew.
Financials moved up to the second spot, Health Care climbed to third, and Industrials entered the top five at fourth place. Real Estate slipped to fifth, while Energy dropped to sixth.
Other moves:
- Materials rose from ninth to seventh.
- Consumer Staples stayed at eighth.
- Consumer Discretionary moved up one slot to ninth.
- Utilities fell from seventh to tenth.
- Communication Services stayed at eleventh.
- Technology – XLK (53%)
- Financials – XLF (19%)
- Health Care – XLV (13%)
- Industrials – XLI (12%)
- Real Estate – XLRE (3%)
- Energy – XLE
- Materials – XLB
- Consumer Staples – XLP
- Consumer Discretionary – XLY
- Utilities – XLU
- Communication Services – XLC
How Weights Shifted This Week
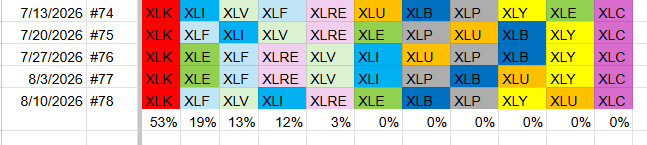
With Industrials now in the top five, its share grew to 12%, while Energy fell behind. Technology’s share dropped to 53%, the biggest reduction among all sectors. Financials and Health Care each slipped a little, and Real Estate stayed small at 3%.
This shows that even though tech is still the leader, its dominance is easing as other big sectors rise.
Weekly Relative Rotation Graph (RRG)
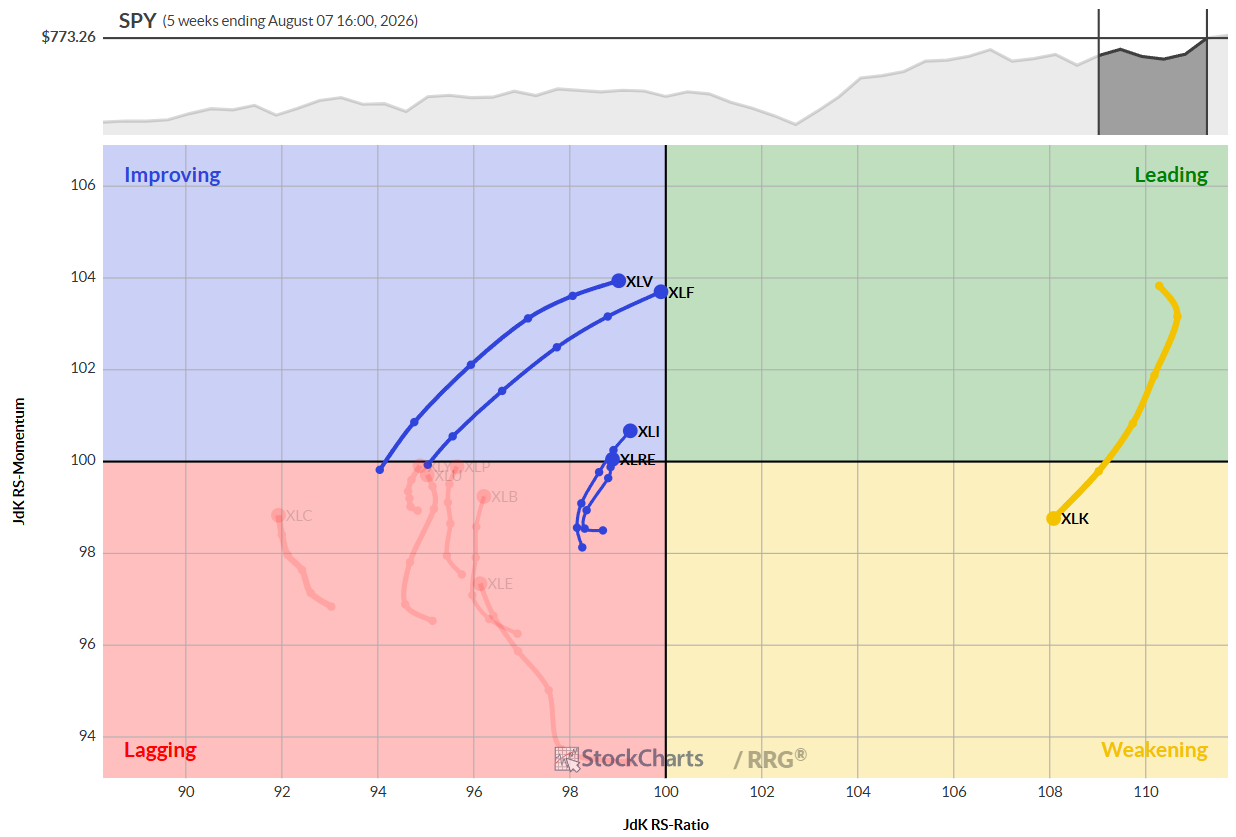
The weekly RRG shows tech moving from the leading corner toward a weaker spot, though it still has a high relative strength value. Health Care and Financials are getting close to the leader area. Industrials and Real Estate are climbing from lagging toward improvement.
Daily Relative Rotation Graph (RRG)
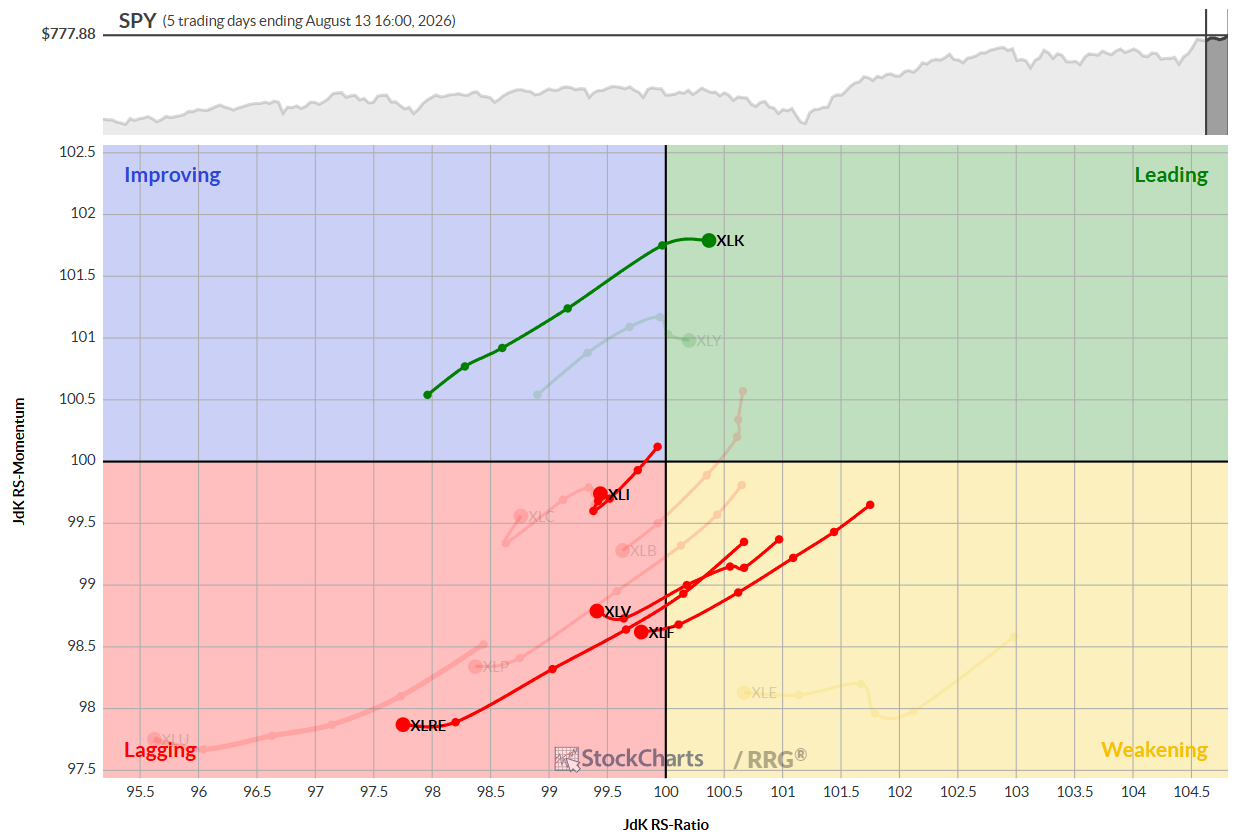
On the daily chart, tech has already moved back into the leader corner. Industrials show a quick bounce upward, while Real Estate, Health Care, and Financials are flattening after a fall, suggesting that their downward push is easing.
Sector Highlights
Technology
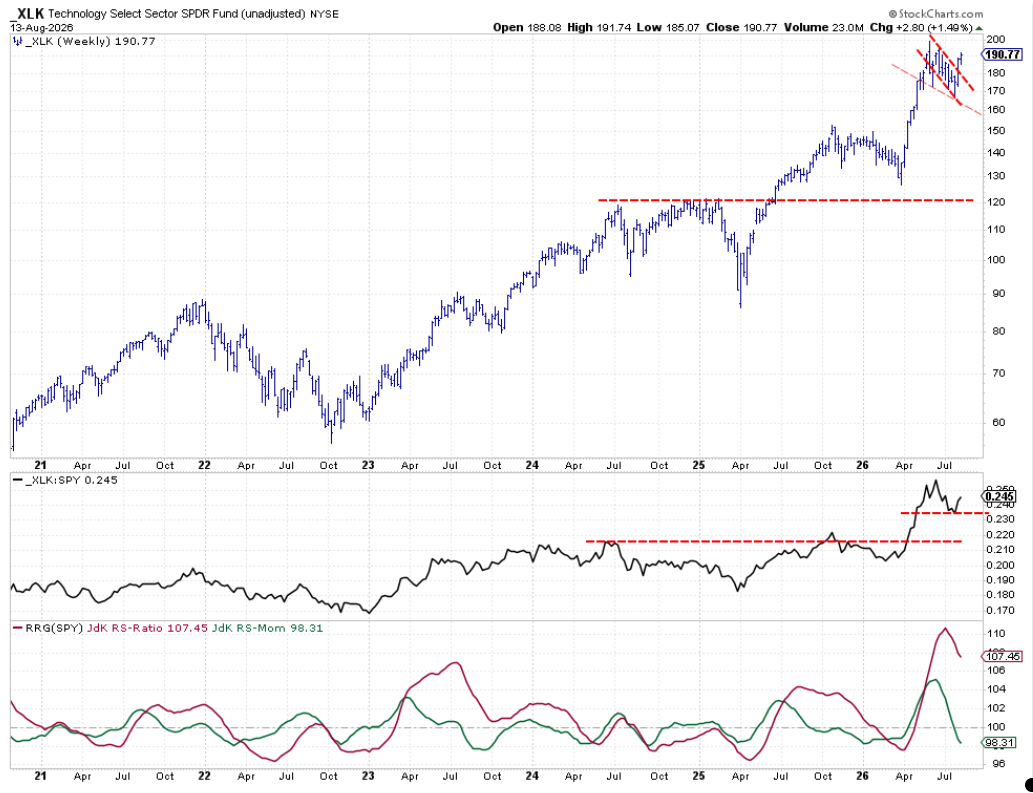
Tech broke out of a tight range and is now close to its highest level ever, near 200 points. The raw relative‑strength line made a higher low, which is a good sign.
Financials
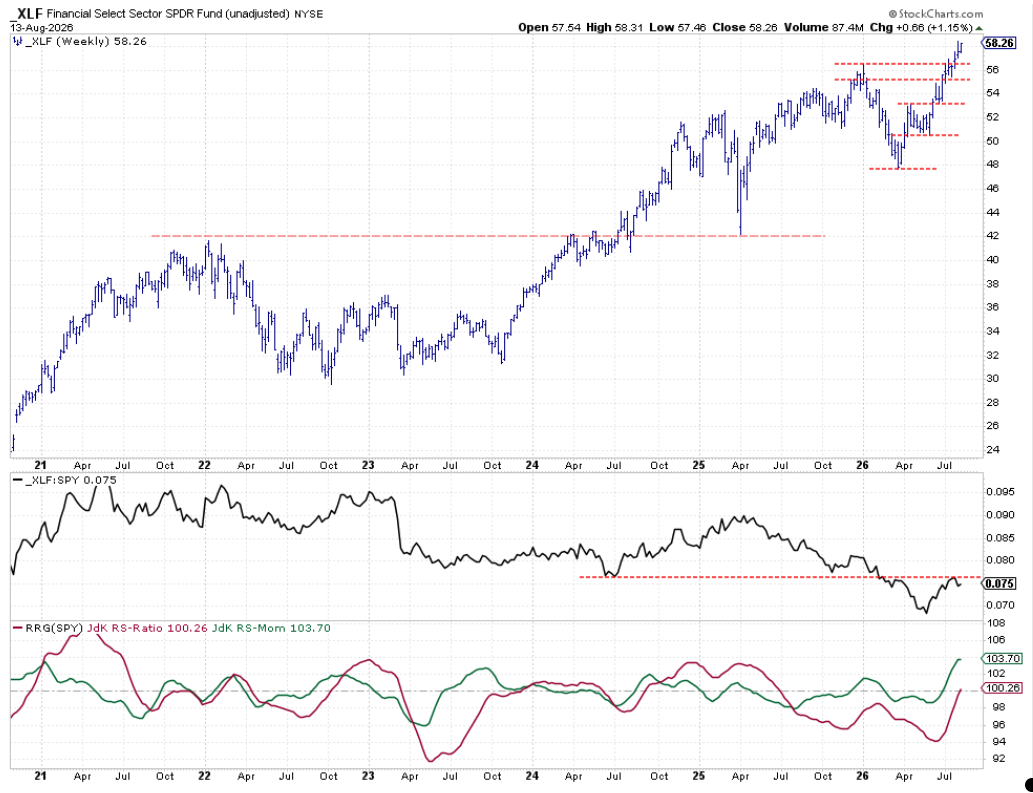
Financials have clearly moved above their last peak and are climbing. The raw strength line meets resistance at earlier lows, but the upward‑pointing RRG lines suggest more gains may follow.
Health Care
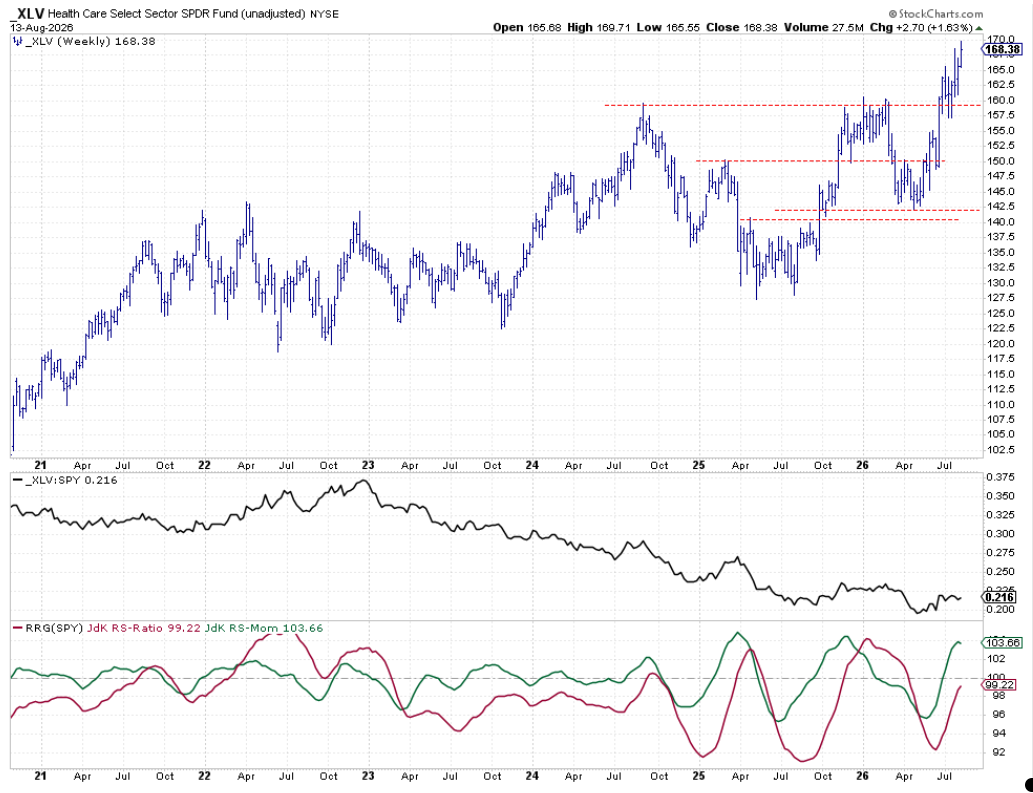
Health Care paused briefly after breaking its 2024‑25 highs, then resumed upward movement. The raw strength line is flattening but starting to rise, pointing toward a possible move into the leader corner.
Industrials
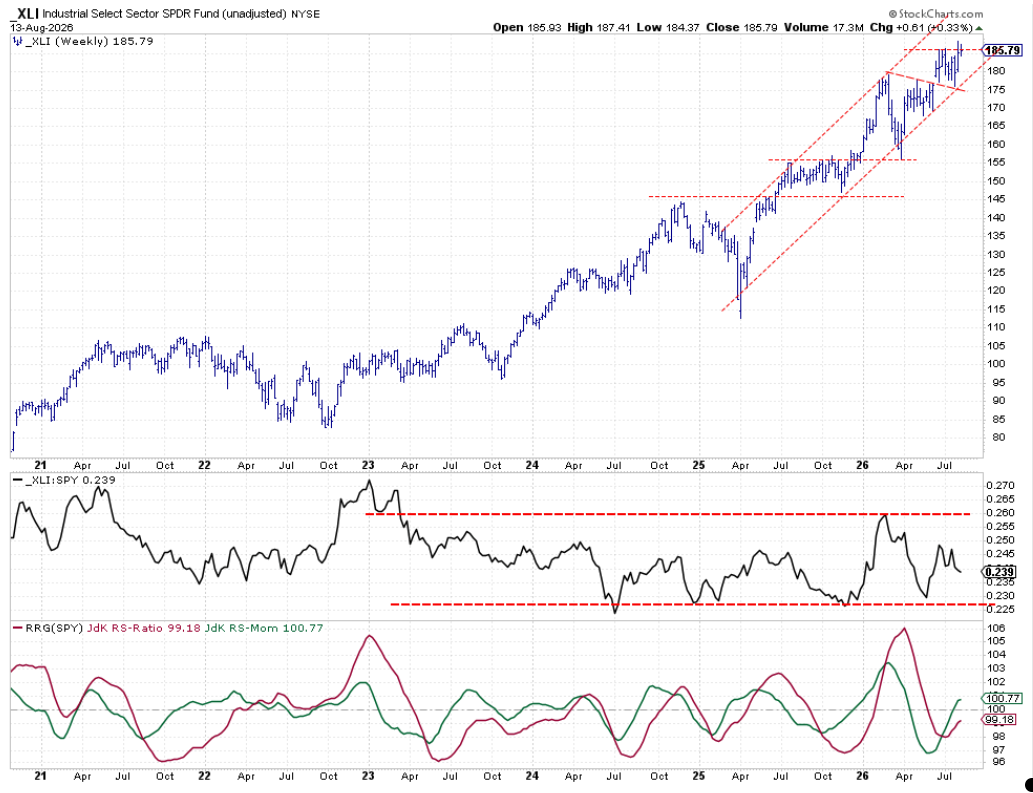
Now in the top five, Industrials stay inside a rising channel and are trying to break their prior high. The raw strength line sits in the middle, while the RRG lines are turning positive.
Real Estate
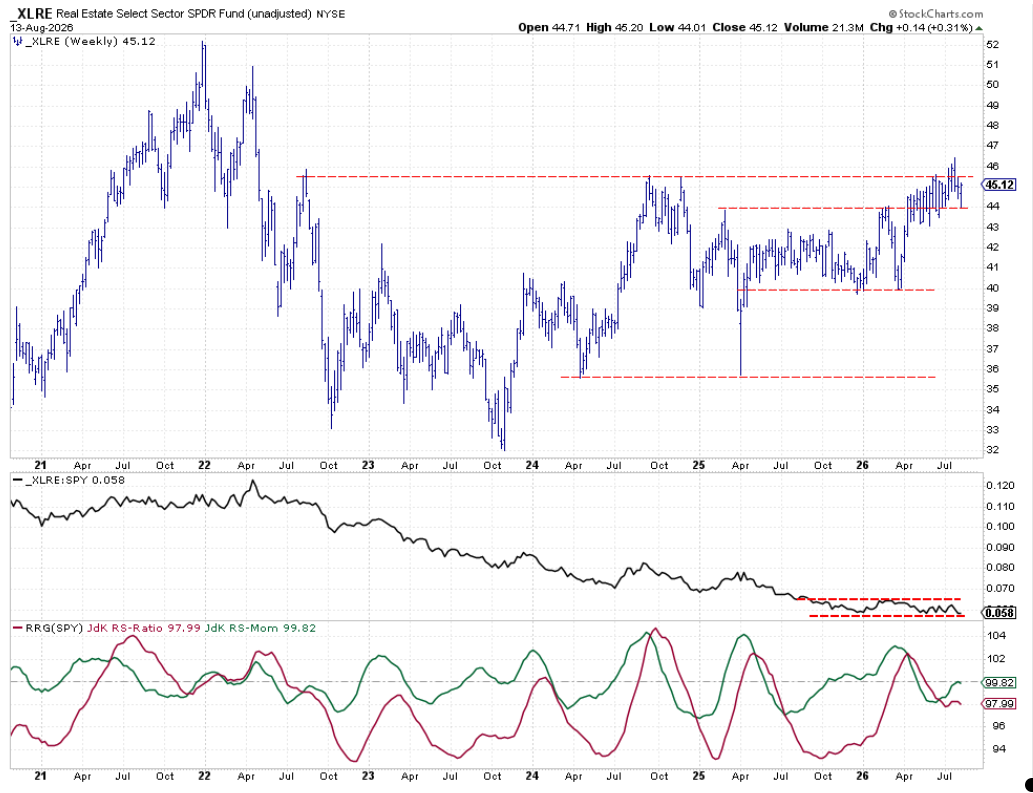
Real Estate is still fighting against resistance set in 2022, 2024, and recently. The sector failed to break higher and is now testing support around 44 points. The raw strength line fell to the bottom, and the RRG lines are flattening, making Real Estate the riskiest of the top five.
Portfolio Performance
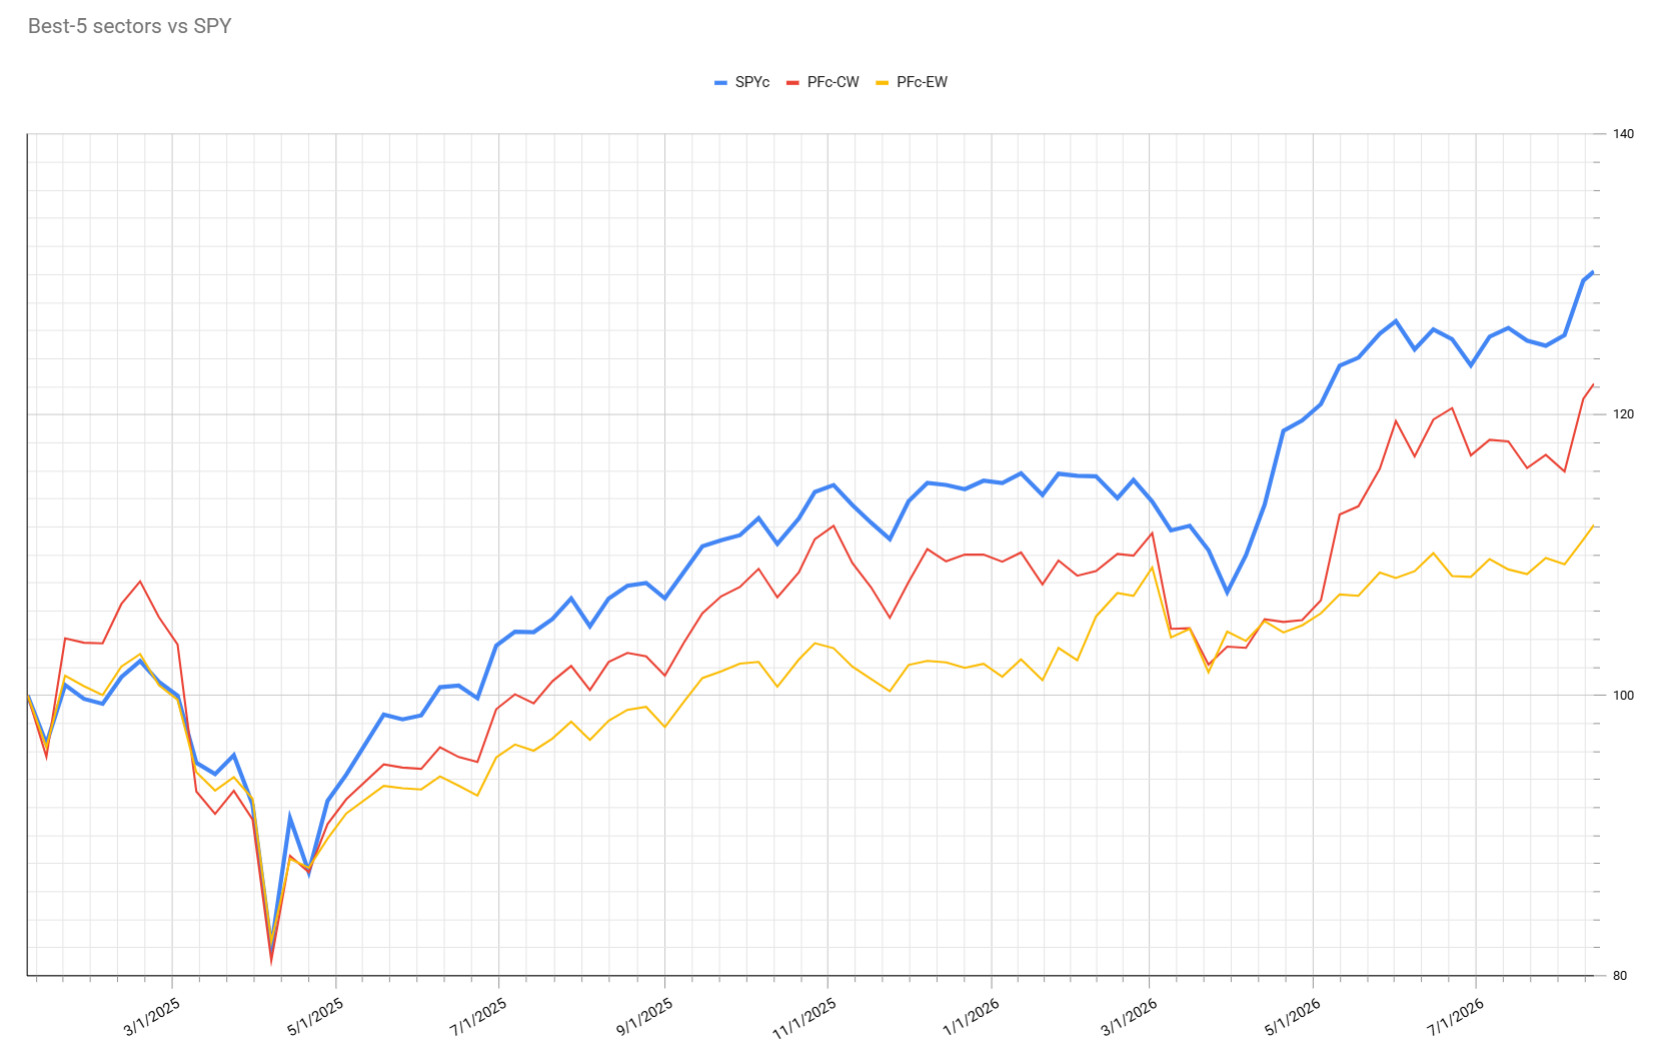
This week the portfolio gained about 1%, narrowing the gap to the S&P 500. It now trails the index by 8% since the start. The improvement is slow but steady, offering hope that the portfolio could eventually match or beat the market.
Source: Materials provided by https://articles.stockcharts.com.Note: Content may be edited for style and length.