
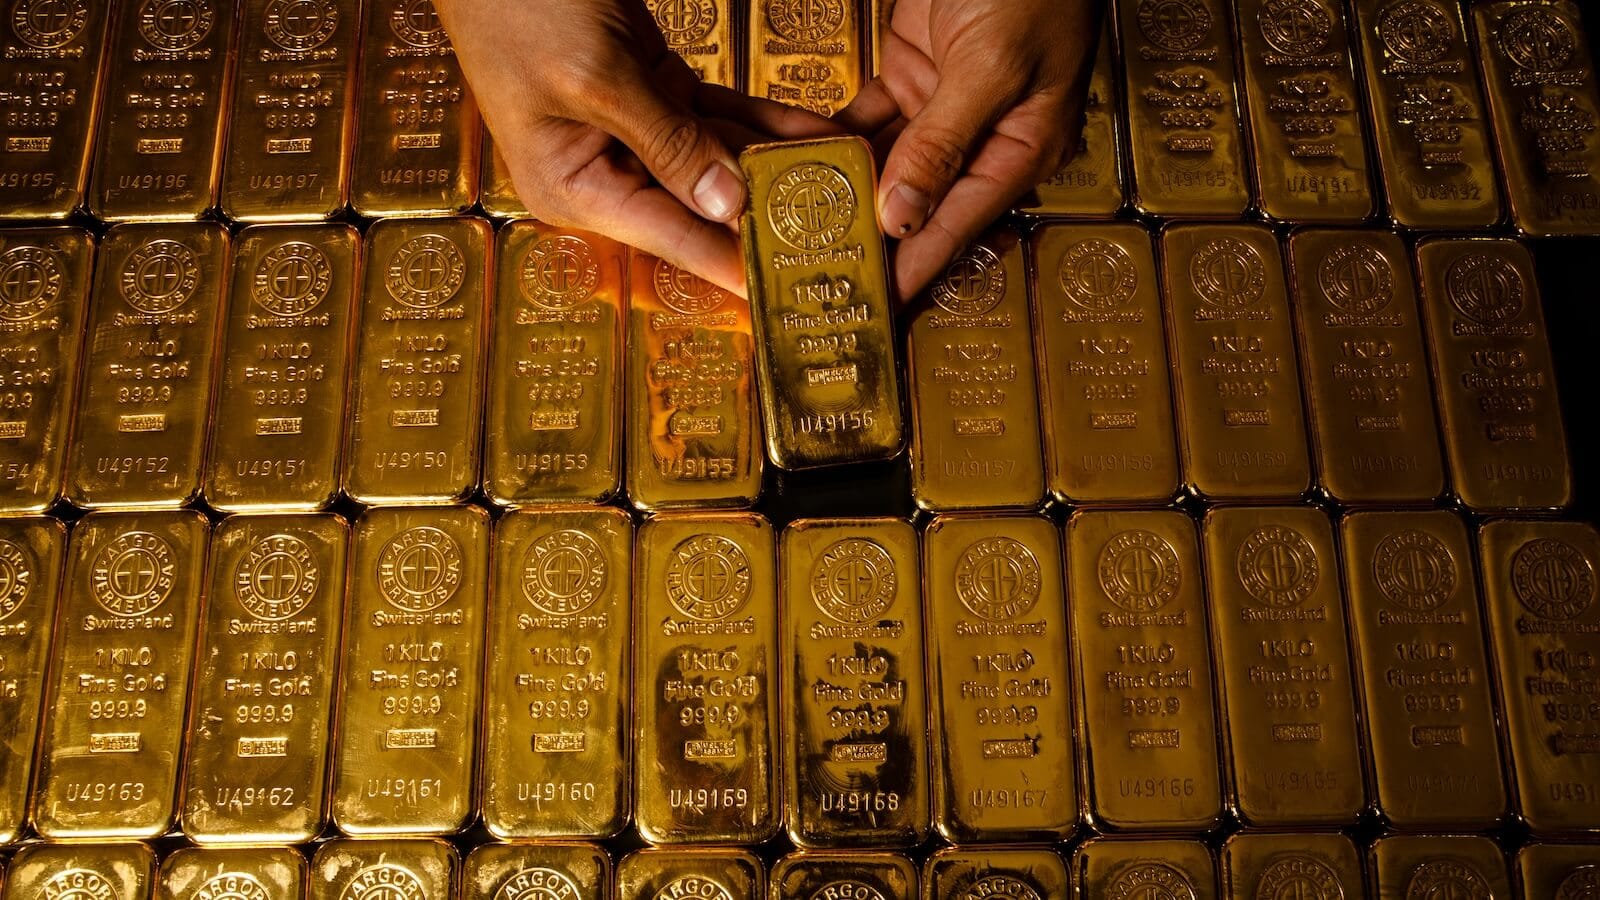
In 2026, gold beat the big stock indexes, but later it fell behind them. Recent moves suggest the metal may be starting a new buying phase.
Below we look at a step‑by‑step way to study gold, explain a few things about gold ETFs, and point out a miner that just broke an important barrier.
Gold Looks Like It Is Starting to Accumulate
After hitting a high in January, the SPDR Gold Shares fund (GLD) fell into a down‑trend, making lower highs and lower lows. The RSI stayed below 50, showing weak momentum.
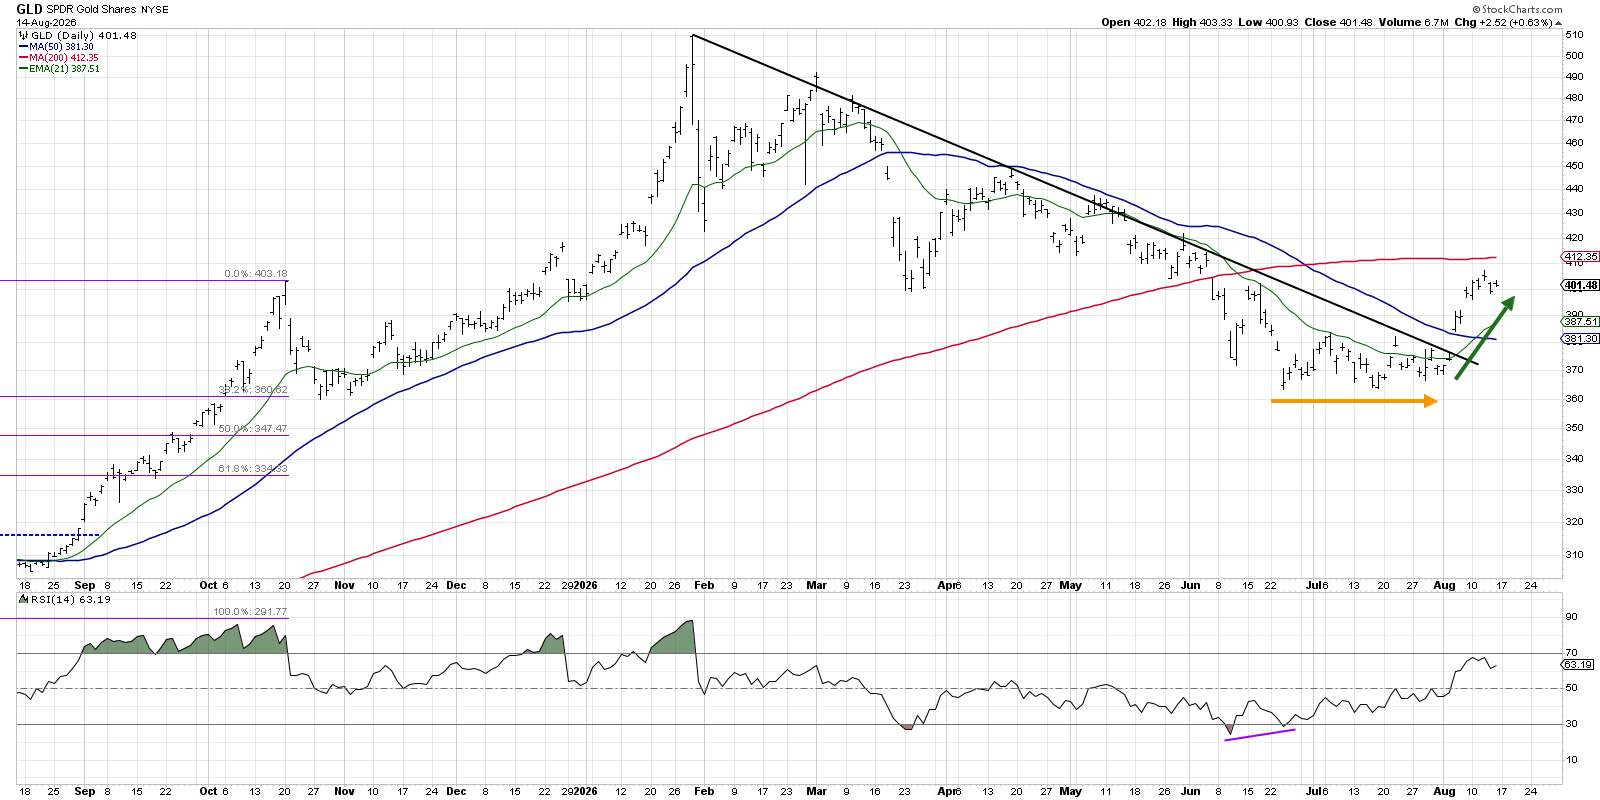
When GLD fell to $365 in late June, it bounced and moved sideways until the end of July. This flat movement acted as a consolidation zone with clear support and resistance.
In early August the fund finally jumped over the trendline resistance, a sign that a fresh buying phase may have begun.
The chart also shows a bullish divergence in June: price made lower lows, but the RSI turned upward. This often signals that the down move is losing steam.
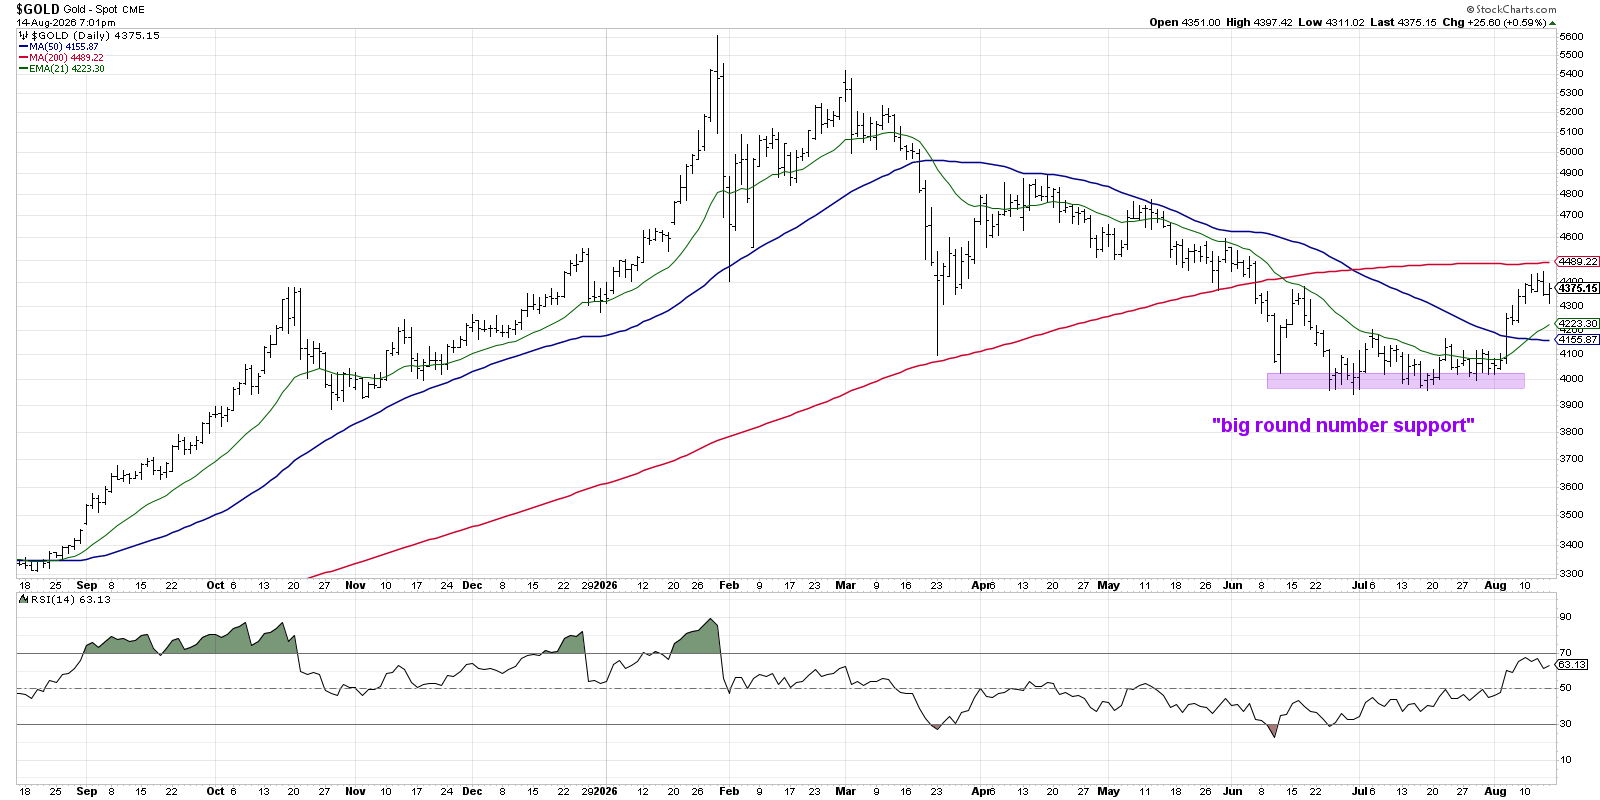
Gold futures found strong support around $4,000 per ounce in June and July. Big round numbers like $4,000 often act as psychological floors for traders.
Gold Miners Are Joining the Uptrend
When gold prices rise, mining stocks usually follow. The VanEck Gold Miners ETF (GDX) broke its trendline and moved back above the 200‑day moving average.
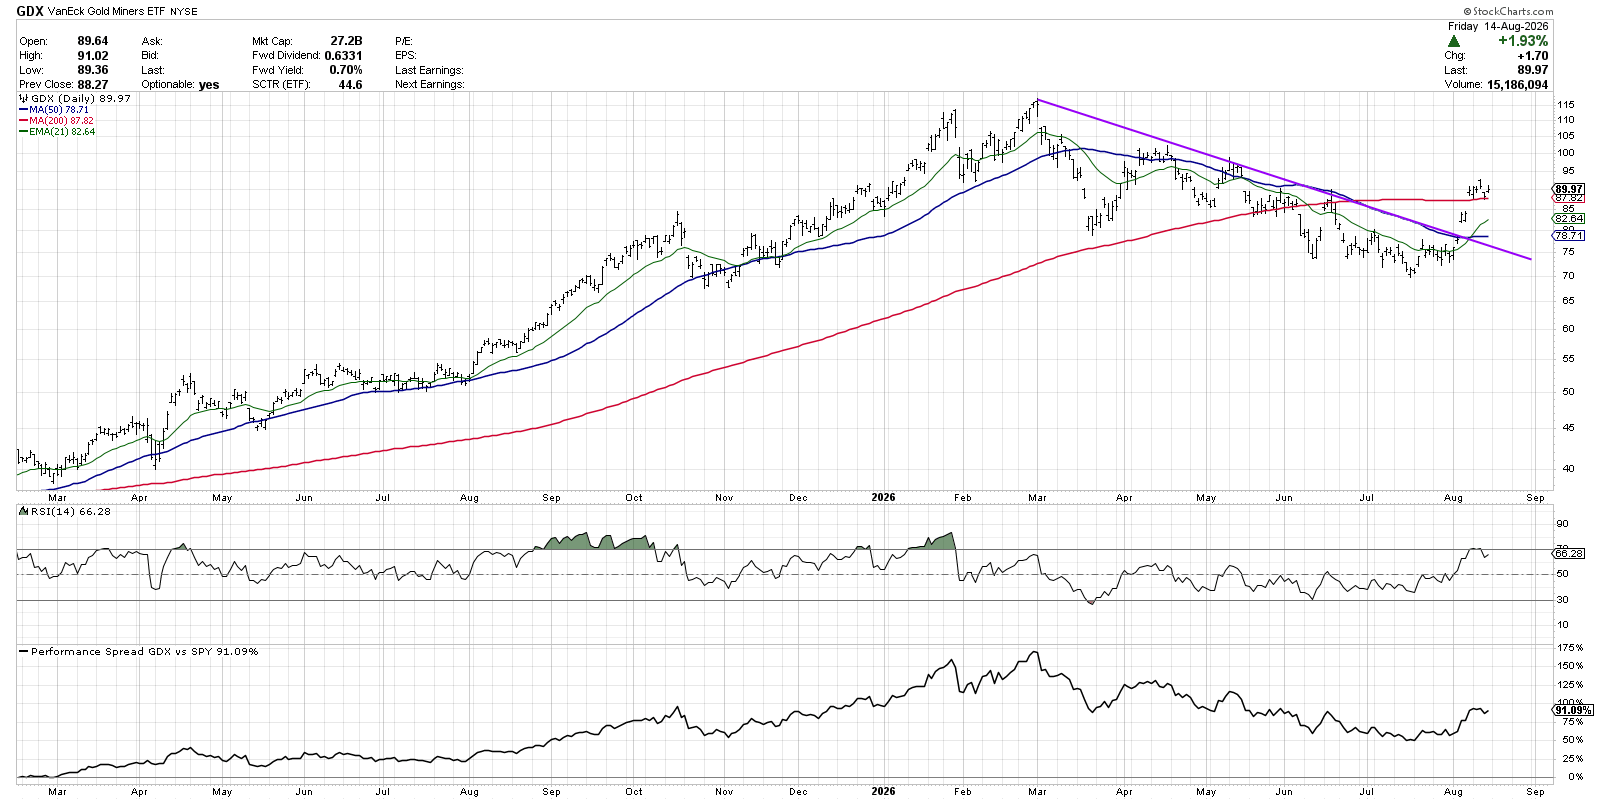
After the breakout, GDX also crossed the 50‑day moving average. In the next few days the RSI rose, showing stronger price momentum. The fund’s relative strength improved over the past month.
Agnico Eagle Mines Breaks Important Levels
All gold miners tend to move together because they depend on spot gold prices. One miner, Agnico Eagle (AEM), stood out by breaking several barriers at once.
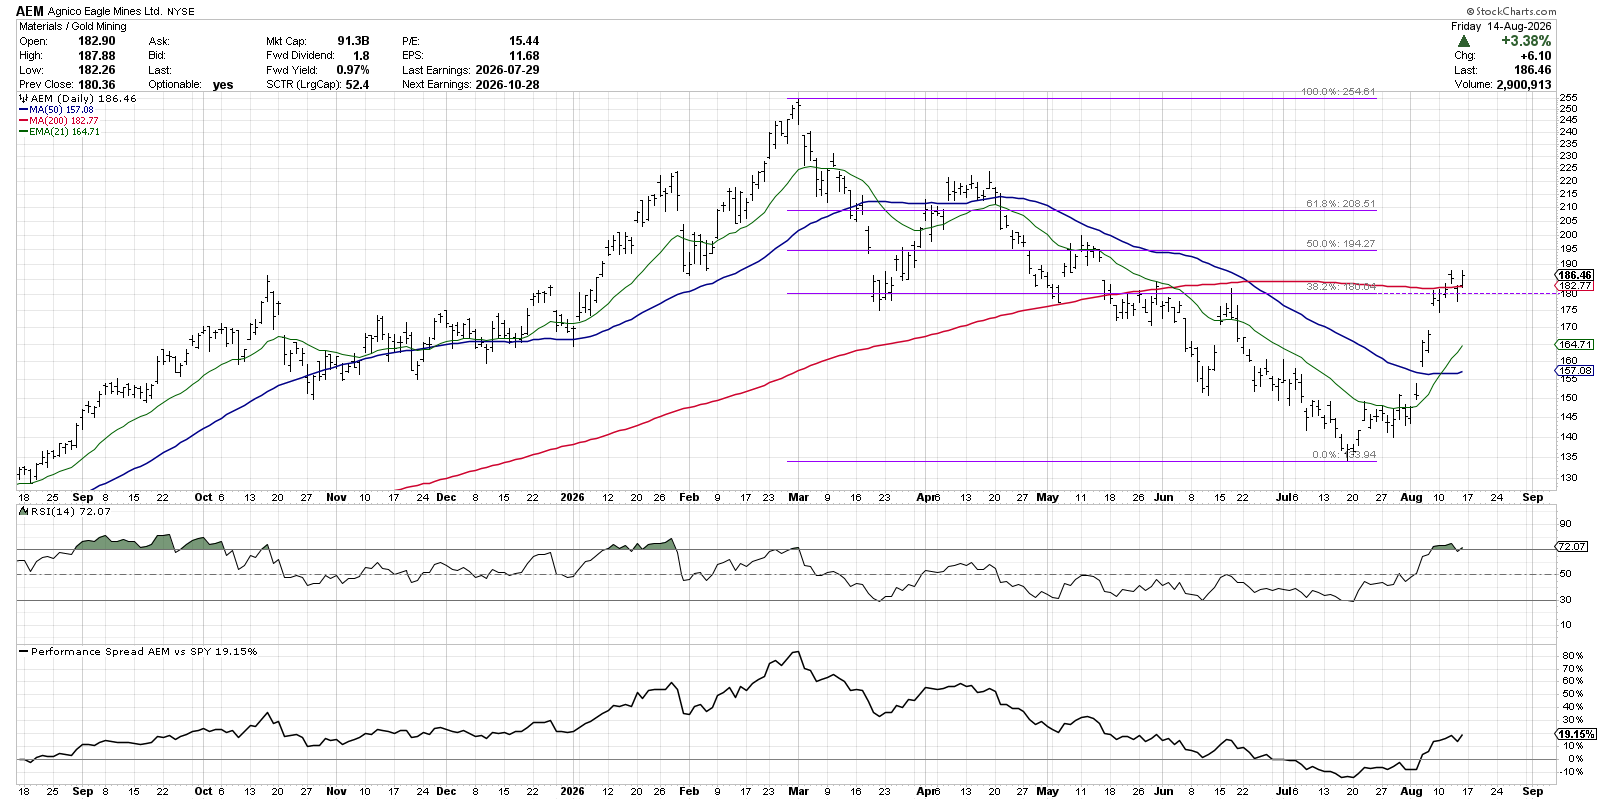
The stock moved above its trendline, then the 200‑day average, and finally the 38.2% Fibonacci retracement near $180. If it can stay above this pivot point, more upside is likely. If it falls below $180, traders may look for other opportunities.
Source: Materials provided by https://articles.stockcharts.com.Note: Content may be edited for style and length.