


Technology stocks and the Nasdaq 100 are showing new energy. Two popular exchange‑traded funds, XLX and QQQ, have broken out of their patterns, and more stocks are staying above their long‑term averages.
XLK Breaks Out with a Strong Push
The XLK fund tracks the Technology Select Sector. After a long dip, the price fell in a channel and then jumped up in April 2026. The move looks like a classic breakout after a correction.
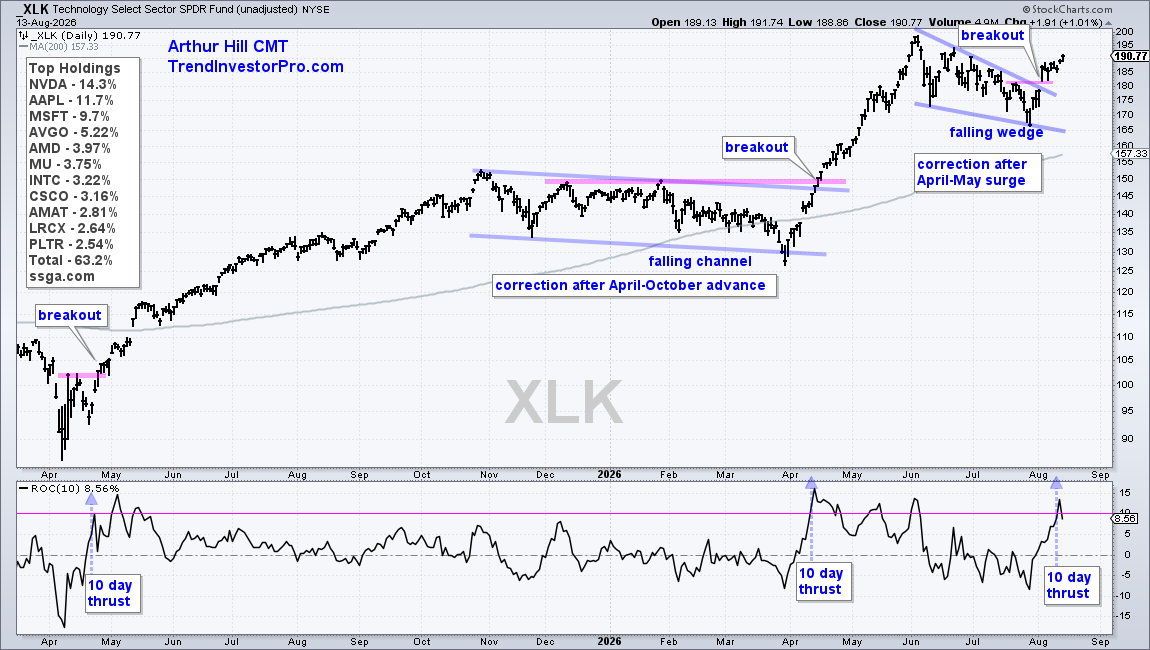
A “price thrust” happens when the 10‑day rate of change is over 10 %. It signals a fast, directional move – like a rocket taking off. In April 2025, April 2026, and August 2026, XLK showed this thrust, confirming the breakout.
- Mid‑August: Semi‑tech ETFs keep rising.
- Early August: Biotech shows strength.
- Early August: AI ETFs look ready to move up.
- Late July: Software and cloud stocks surge.
QQQ Breaks Out as More Stocks Join In
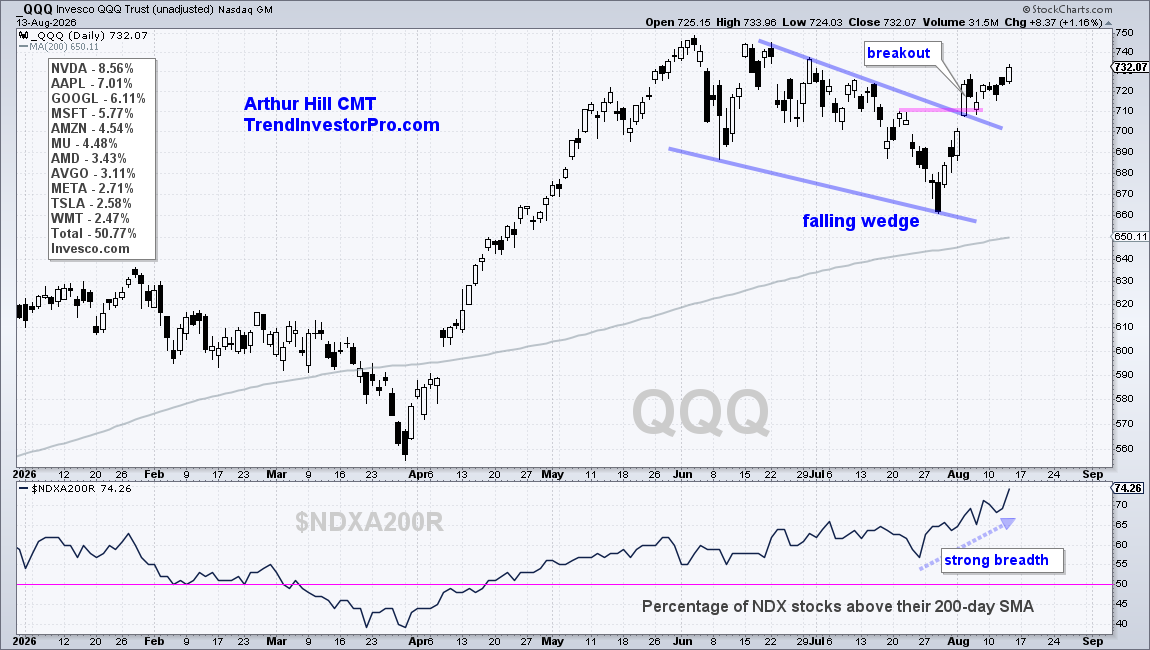
The QQQ fund follows the Nasdaq 100. It also formed a falling wedge and broke out in early August. At the same time, the share of Nasdaq 100 stocks above their 200‑day moving average rose from 57 % to 74 % – the highest level this year.
Equal‑Weight QQQ Leads the Pack
The First Trust III Nasdaq 100 Select Equal‑Weight ETF (QQEW) spreads weight more evenly than QQQ. While QQQ is topped by its ten biggest holdings, QQEW’s top ten make up only about 27 %.
QQEW reached a new high on August 4 and pushed higher again this week, outpacing QQQ, which is still below its June peak.
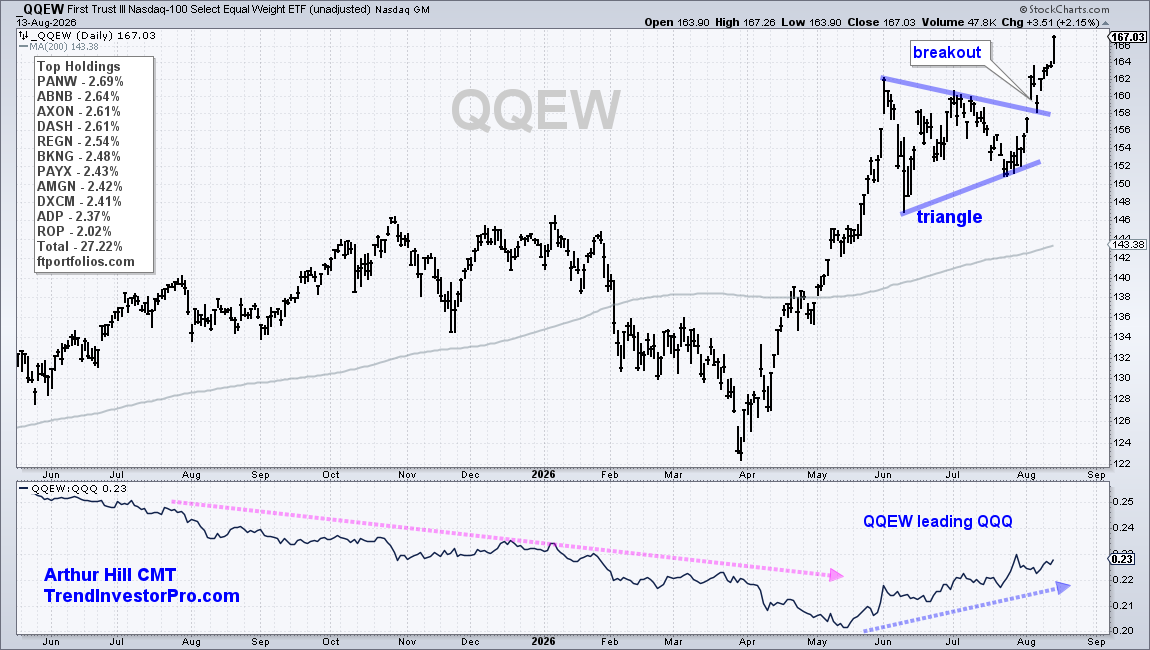
One way to see who is ahead is to compare the price ratio QQEW/QQQ. When the ratio rises, QQEW is beating QQQ; when it falls, QQQ is stronger. The ratio turned upward in the last few months, showing QQEW’s recent leadership.
Source: Materials provided by https://articles.stockcharts.com.Note: Content may be edited for style and length.