
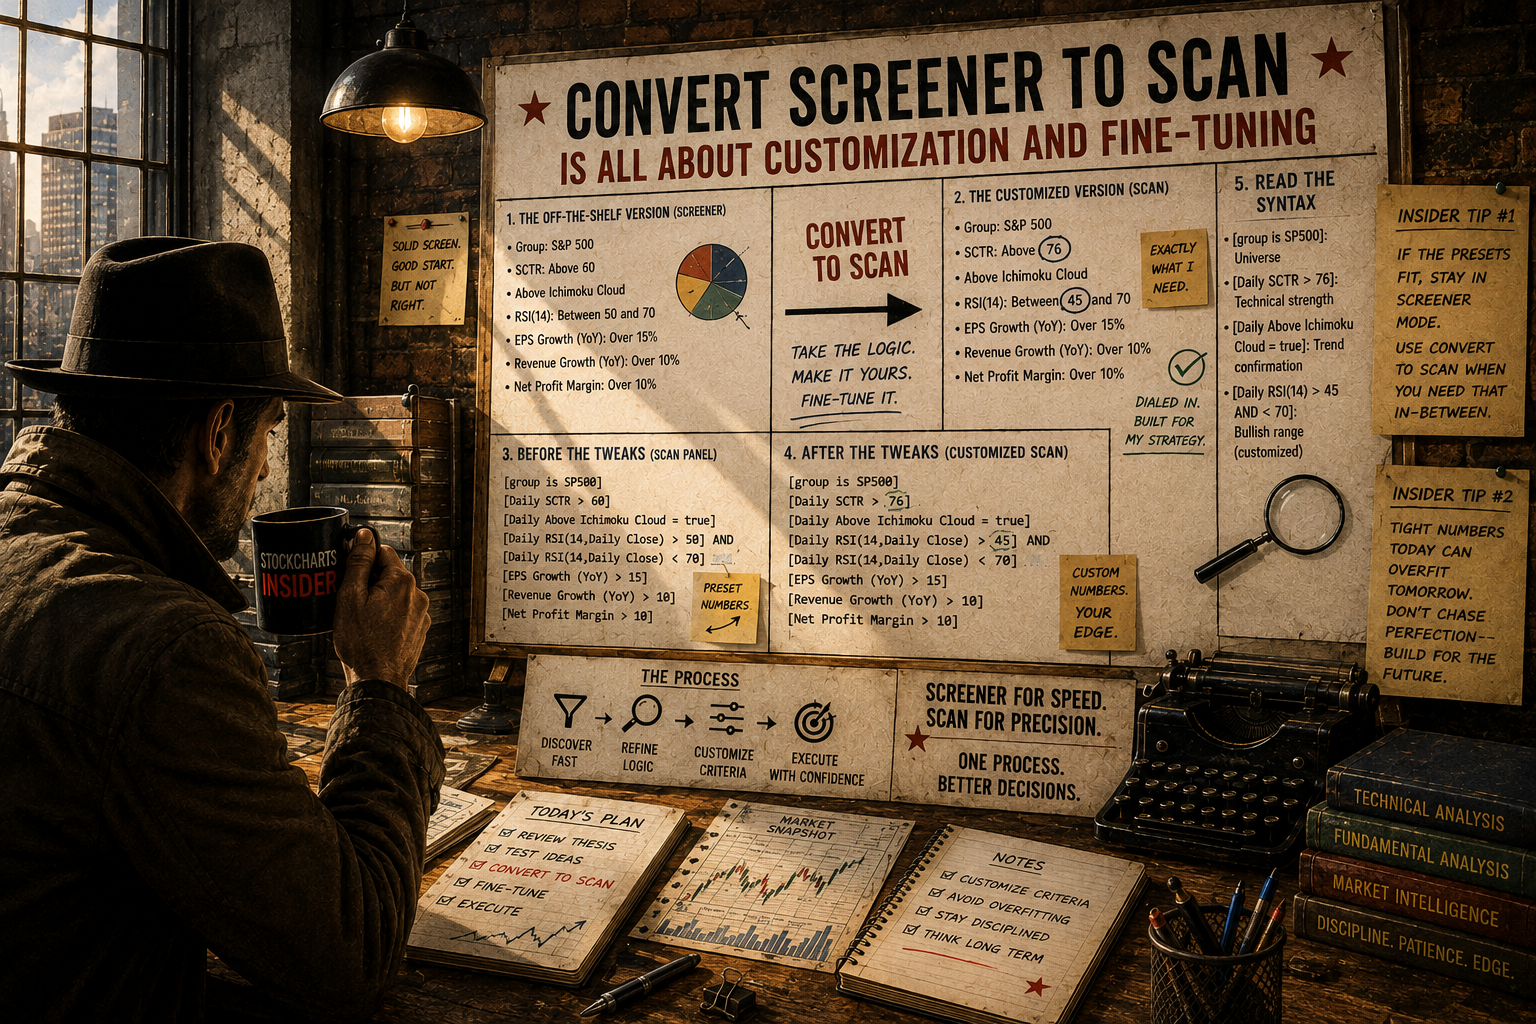
Before we start…
The StockCharts Screener is quick and easy. You pick a few indicators, press a button, and get a list of stocks. But sometimes the preset choices don’t fit exactly what you need.
When that happens, click the Convert to Scan button. It lets you change the numbers that the Screener gave you, so the results match your own plan.
Why You Might Want a Custom Scan
The Screener offers common groups like SCTR > 20, 40, 60, 80, 90 or RSI ranges such as 30‑70. Those work for many traders, but they are broad.
If you need a value that isn’t on the list—say SCTR > 76 instead of > 60—you have to fine‑tune the filter. That’s what Convert to Scan does.
Example of a Basic Screen
Imagine you built this rule set:
Group: S&P 500
SCTR above 60
Above Ichimoku Cloud
RSI(14) between 50 and 70
EPS growth > 15 % YoY
Revenue growth > 10 % YoY
Net profit margin > 10 %
This screen looks solid, but you want SCTR > 76 and an RSI range of 45‑70. Those exact numbers aren’t offered as presets.
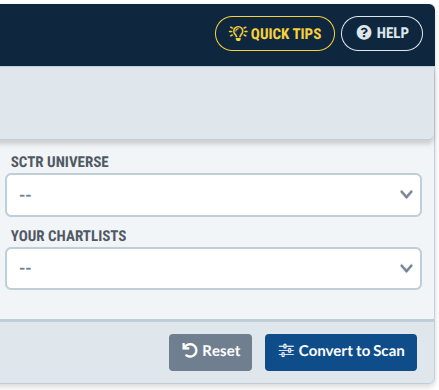
The blue button at the lower left of the Screener opens the Convert to Scan panel. Press it after you set all your basic criteria.
Changing the Numbers
In the Convert to Scan view you’ll see the same filters, but now you can edit them.
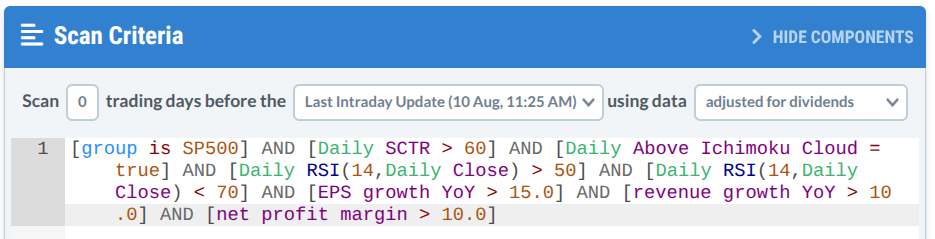
Replace the SCTR value 60 with 76, and change the RSI low limit from 50 to 45. The scan now matches your exact preferences.
Understanding the Scan Syntax
Think of the syntax like a simple sentence:
- [group is SP500] – the list of stocks you are looking at.
- [Daily SCTR > 76] – technical strength above 76.
- [Daily Above Ichimoku Cloud = true] – price must sit above the cloud.
- [Daily RSI(14) > 45] AND [Daily RSI(14) < 70] – a bullish but not over‑bought range.
The Convert to Scan tool writes this for you, so you don’t have to type the code yourself.
Insider Tip #1 – When to Switch
If the preset filters already fit your plan, stay with the Screener. It’s faster and great for testing many ideas quickly.
Use Convert to Scan only when you need a number that sits between two presets or when a required metric isn’t offered.
Insider Tip #2 – Avoid Over‑Fitting
It’s tempting to keep tweaking numbers until the current list looks perfect. That can lead to “over‑fitting” – a scan that works only for today’s market.
Set parameters that are reasonable, not just the ones that give the best short‑term results. A balanced scan will keep working when market conditions change.
Final Thoughts
The Screener gives you speed. Convert to Scan gives you precision. Use both together: start with the quick screener, then fine‑tune the filters with Convert to Scan when you need that extra level of control.
Source: Materials provided by https://articles.stockcharts.com.Note: Content may be edited for style and length.