
Fibonacci retracements give traders a clear way to see where a price might turn. By looking at two extreme prices, we can draw levels that often act as support or resistance.
Below we will walk through two real stocks—Nvidia (NVDA) and Adobe (ADBE)—to show how the tool works.

Example 1: Nvidia
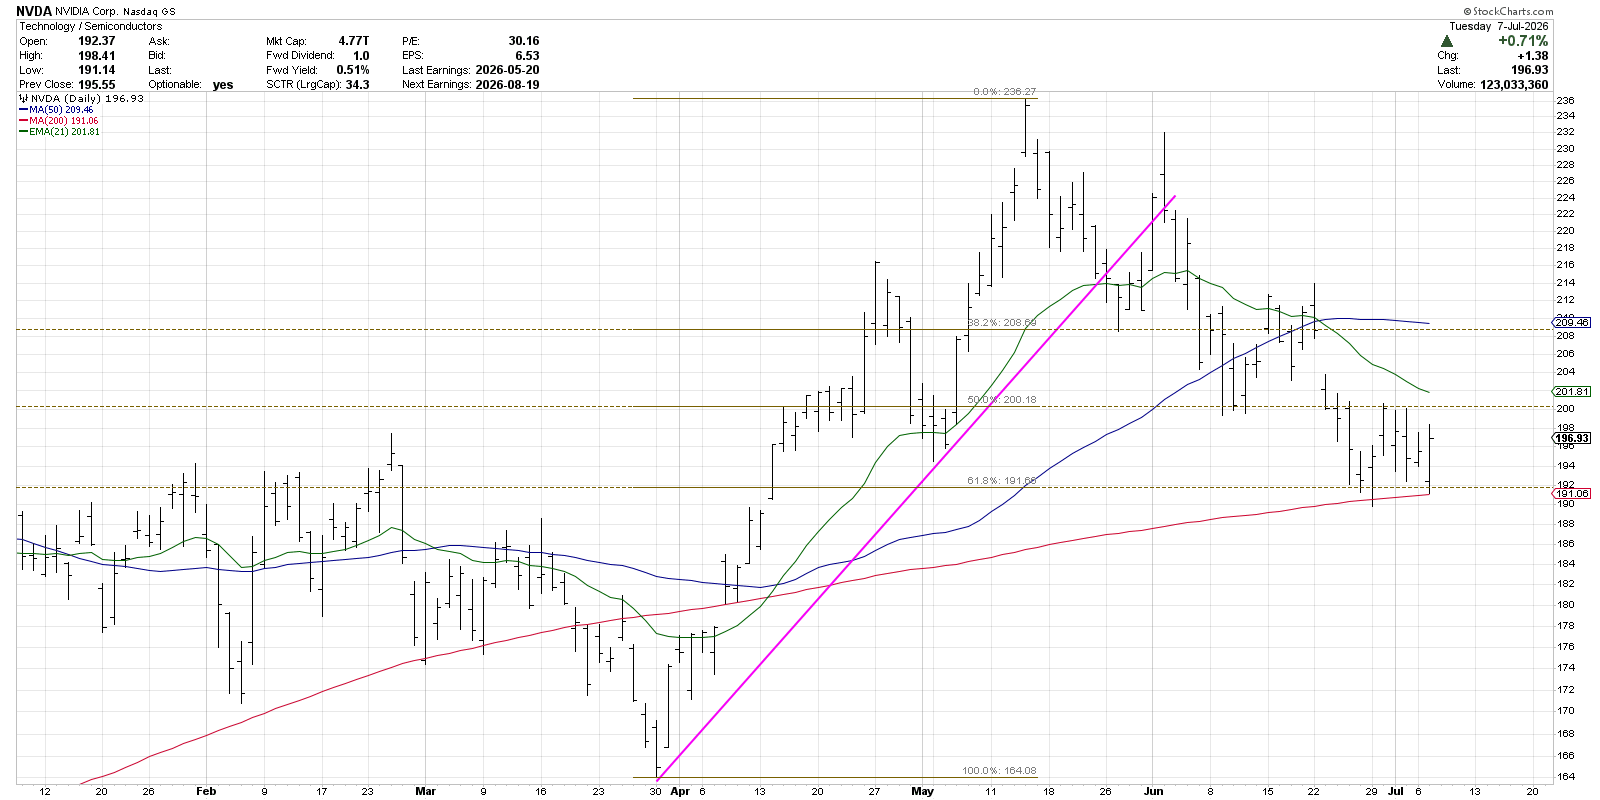
From a low of $164 on March 30 to a high of $236 in May, Nvidia made a big move. When the price fell back, it crossed the 21‑day moving average and a trendline that connected the recent lows.
Applying Fibonacci retracements gave a first support level around $209 (38.2%). By mid‑June the price bounced off the 38.2% and 50% levels, then fell toward the 61.8% level near $176.
That 61.8% level also lines up with the 200‑day moving average. If Nvidia can stay above this point, it may start a new upward phase. A break below could send the price back toward the March low.
Example 2: Adobe
Adobe has been in a downtrend for more than two years. When a chart has many swing highs, we must choose the points that matter for the timeframe we are using.
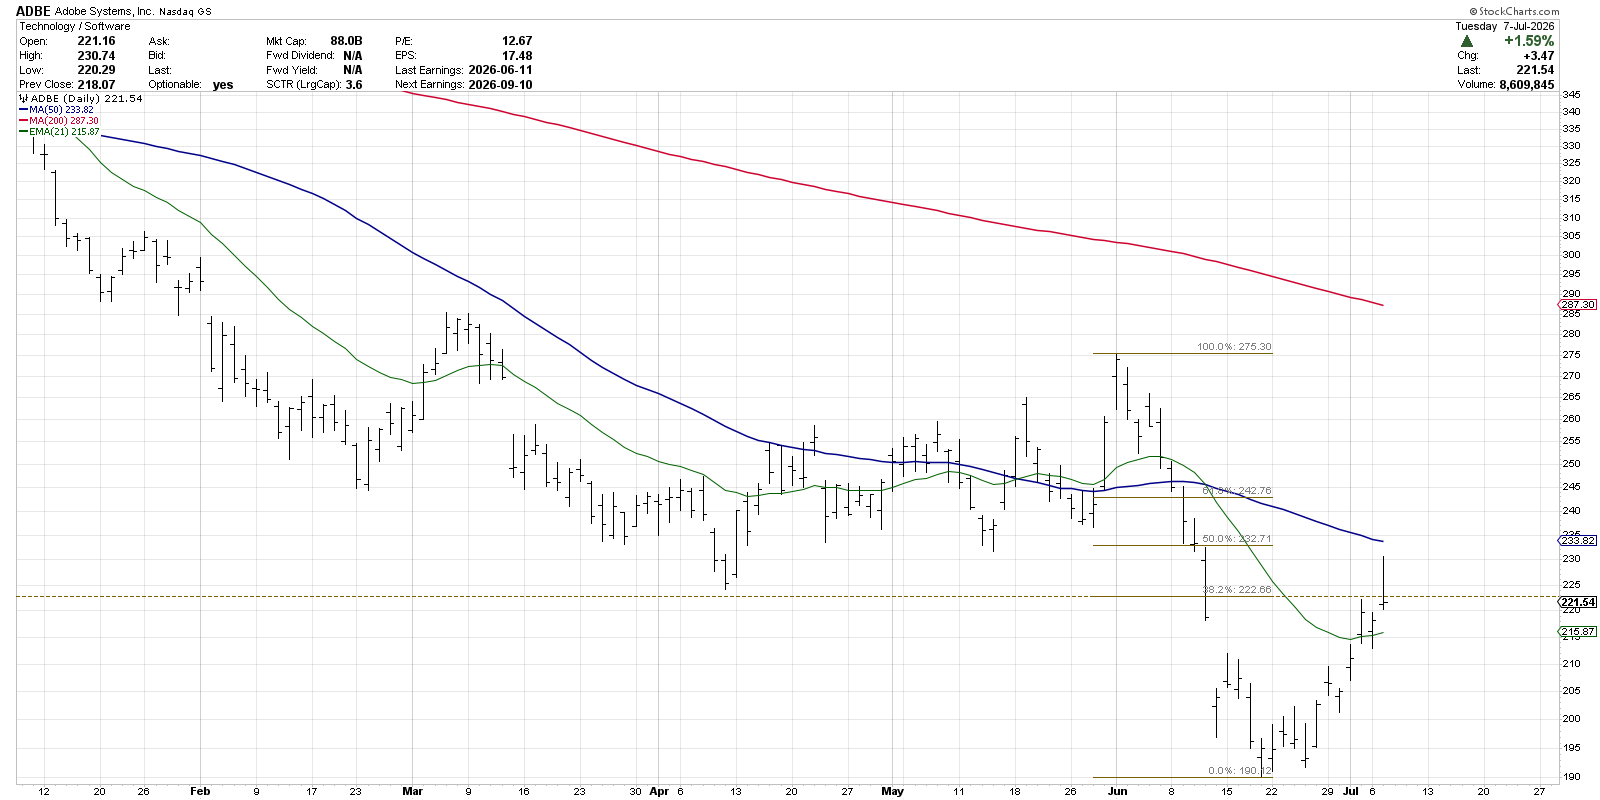
For a short‑term swing trade, we look at a six‑month chart. The low in June was about $190, and the price later rose to $223. That $223 point acted as a resistance level and was met with a “gravestone doji” candle, hinting at a pull‑back.
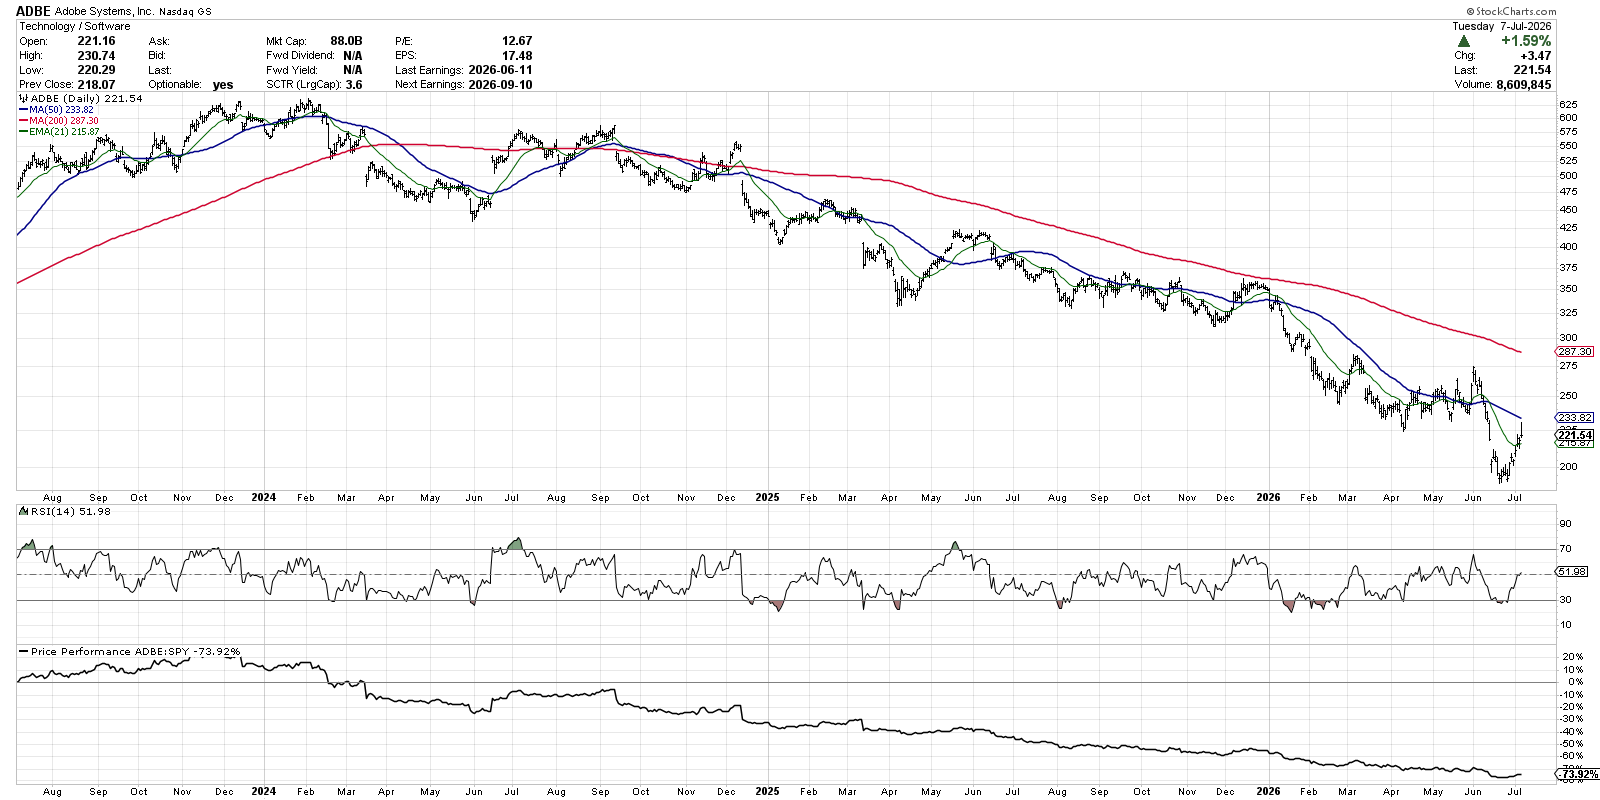
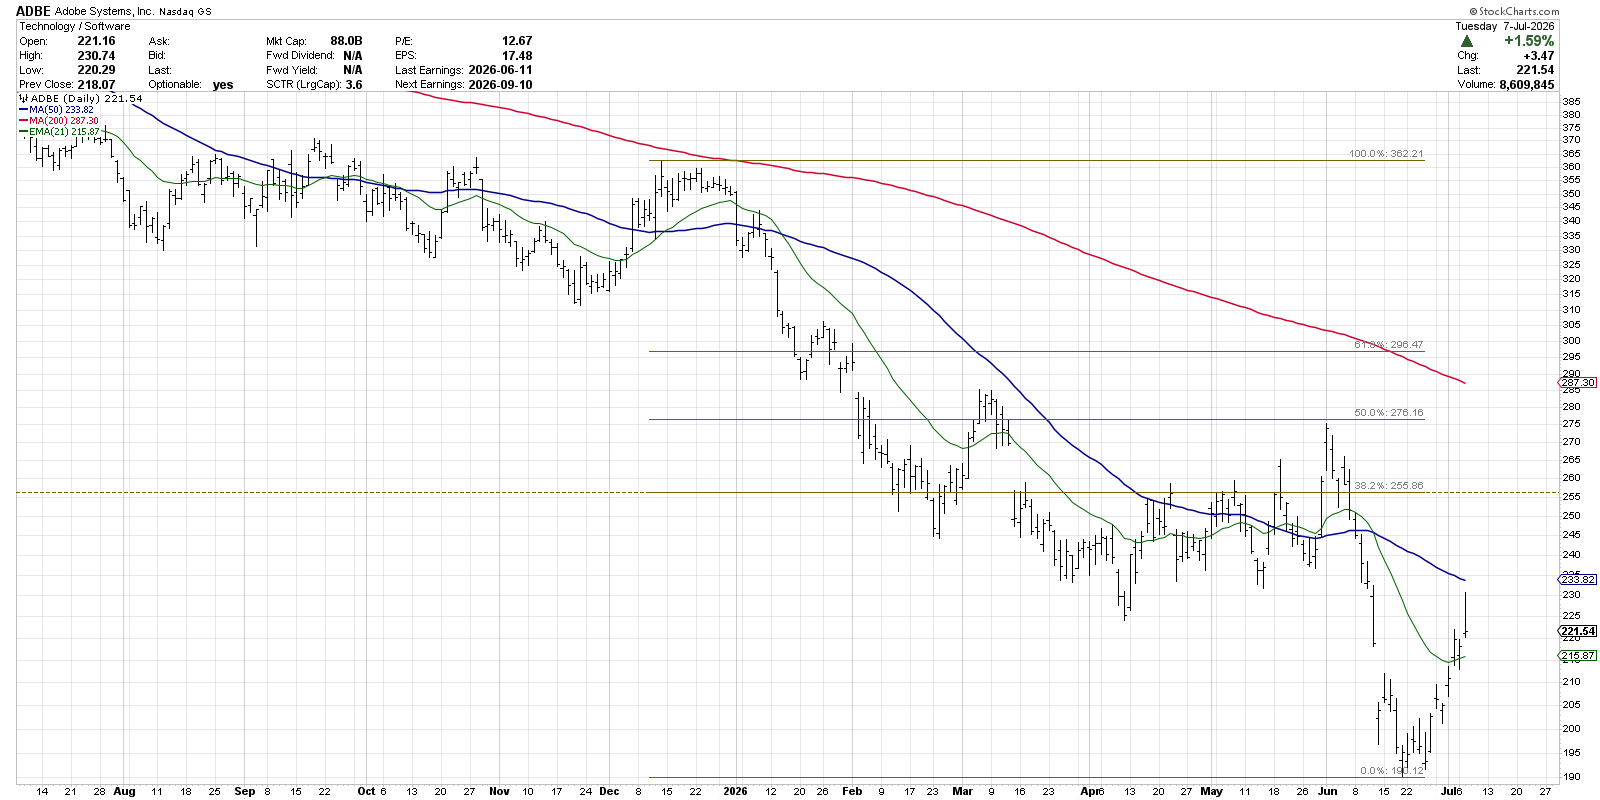
Zooming out to a full‑year view shows the recent rise is only a small bump in a larger decline. Using the December swing high (before the big drop in January) as the top point, the 38.2% Fibonacci level lands near $256, which could be a medium‑term target.
Fibonacci retracements do not tell us exactly where a price must turn. They simply point out zones where a turn is more likely. When you combine these zones with trend lines and momentum clues, you get a disciplined way to plan trades instead of reacting to surprises.
Disclaimer: This material is for educational purposes only and is not financial advice. Always consider your own situation and consult a professional before making investment decisions.
Source: Materials provided by https://articles.stockcharts.com.Note: Content may be edited for style and length.