
The S&P 500 finished the week ending July 3 with a solid 2% gain, even though the market closed early for a holiday. The index moved higher, but some quiet changes happened underneath.
Technology stayed the strongest sector. Industrials and Real Estate held the second and third spots. Materials and Financials completed the top‑five group. The list looks the same as last week, but the lower‑ranked sectors are shifting.
Health Care jumped from ninth to sixth place in just one week. Utilities slipped a spot, and Energy fell from seventh to ninth. Consumer Staples stayed steady at eighth, while Consumer Discretionary and Communication Services stayed at the bottom.
- Technology (XLK) – 59%
- Industrials (XLI) – 13%
- Real Estate (XLRE) – 3%
- Materials (XLB) – 3%
- Financials (XLF) – 21%
- Health Care (XLV)
- Utilities (XLU)
- Consumer Staples (XLP)
- Energy (XLE)
- Consumer Discretionary (XLY)
- Communication Services (XLC)
Weekly Relative‑Strength Graphic (RRG)
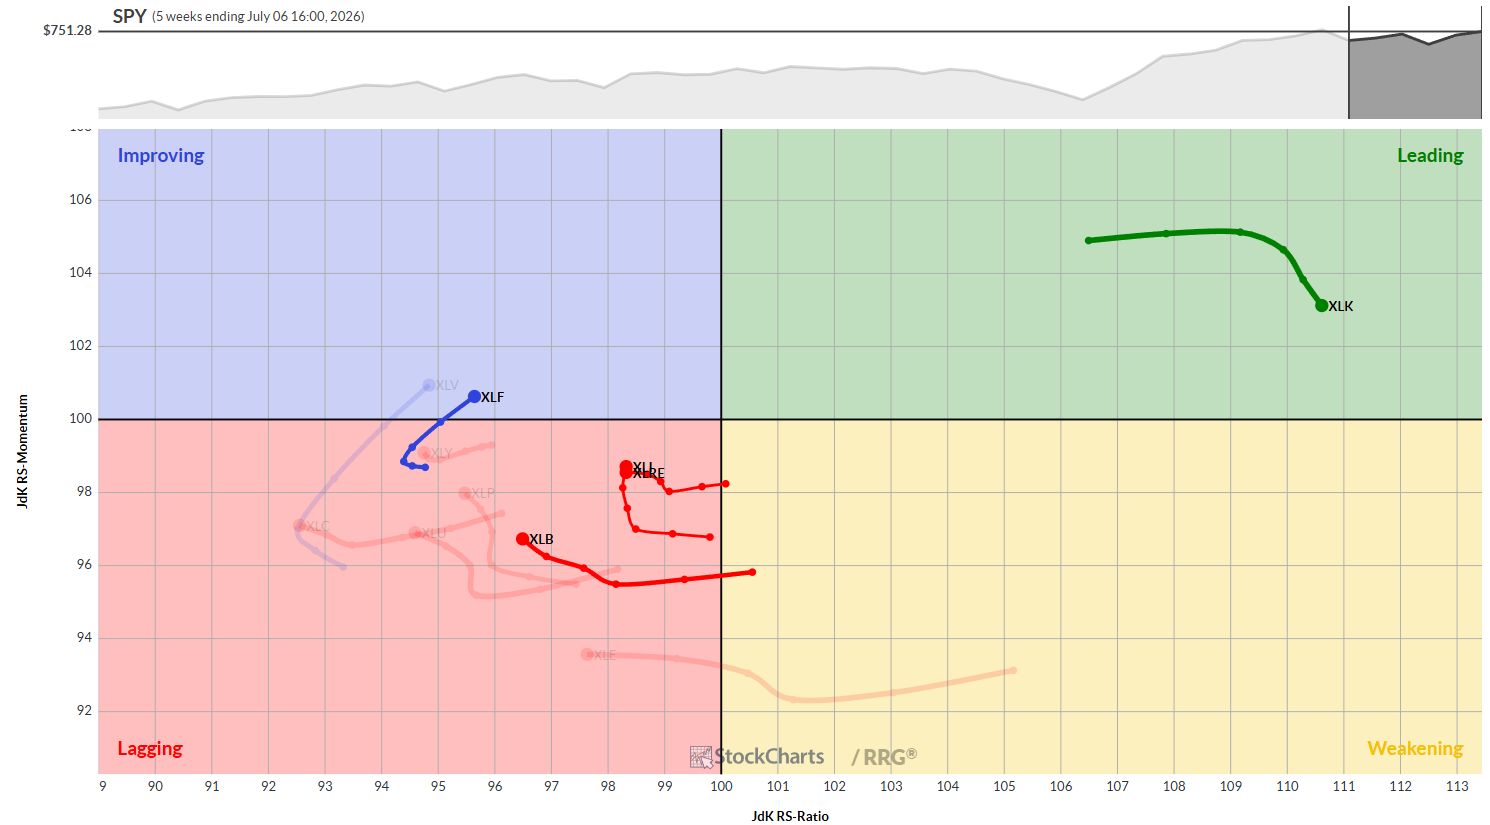
In the weekly RRG chart, Technology sits alone in the leading corner. All other sectors cluster on the left side, showing weaker momentum.
Financials and Health Care have moved into the "improving" area, hinting that they may lead soon. Materials, Industrials and Real Estate are still lagging but beginning to show a little life.
Daily Relative‑Strength Graphic (RRG)
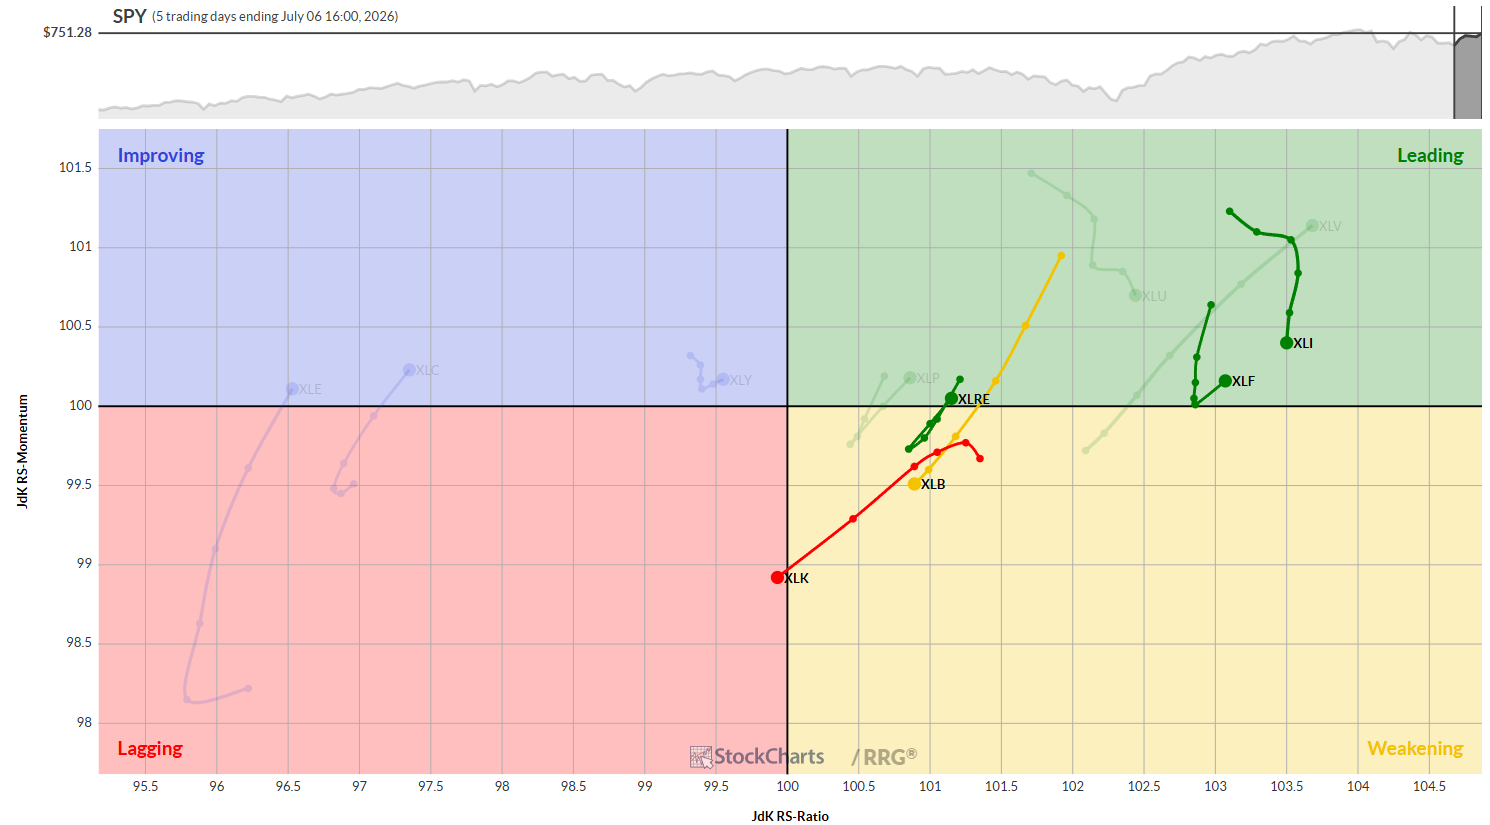
On the daily chart, Technology is slipping into the lagging corner even though it stays on top in the weekly view. This mixed picture shows that short‑term momentum is weakening while the longer trend stays strong.
Materials is sliding toward the weakening area. Real Estate and Financials are gaining a bit of upward momentum. Industrials stays in the leading corner but is losing some speed.
Sector Highlights
Technology
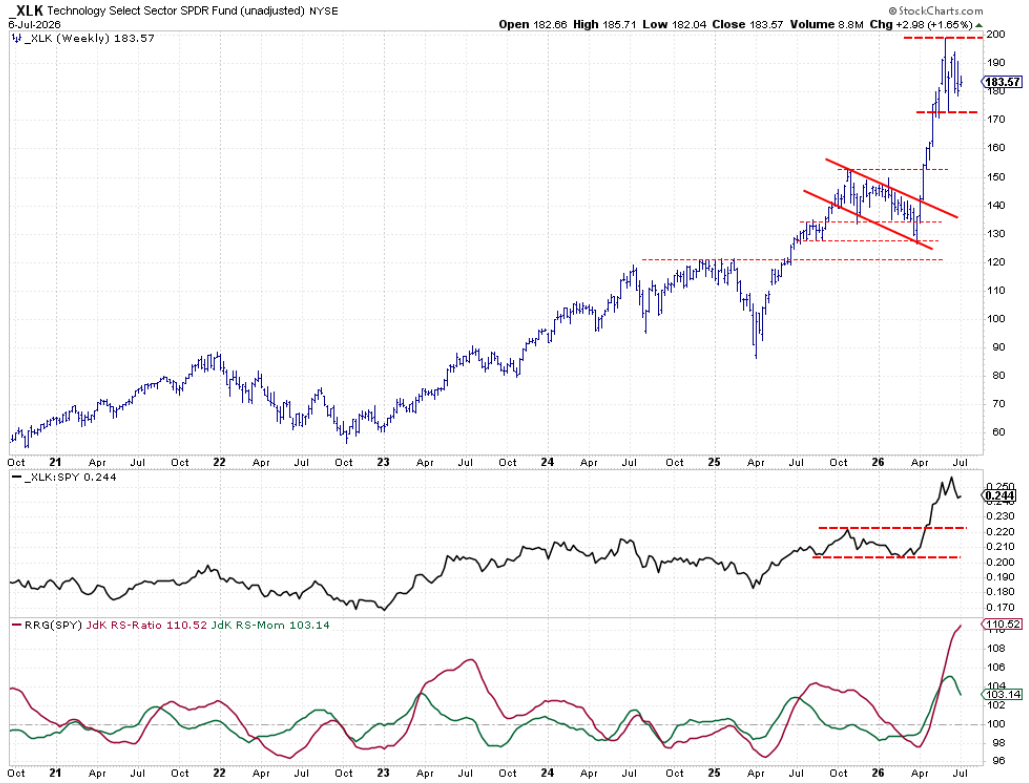
Tech prices are moving sideways inside a tight range. The sector still shows strong relative strength, but the momentum line is turning down, suggesting the rally may be slowing.
Industrials
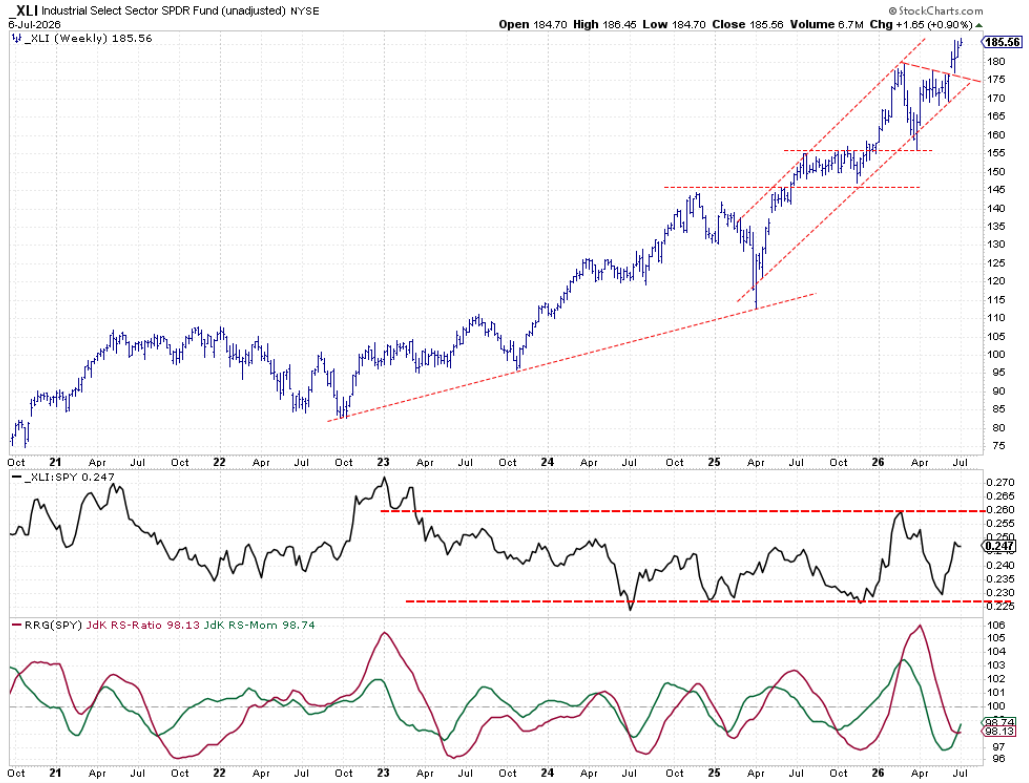
Industrials have broken out of a triangle and are now climbing inside a rising channel. Strength is mid‑range and momentum is turning up, so more gains could follow.
Real Estate
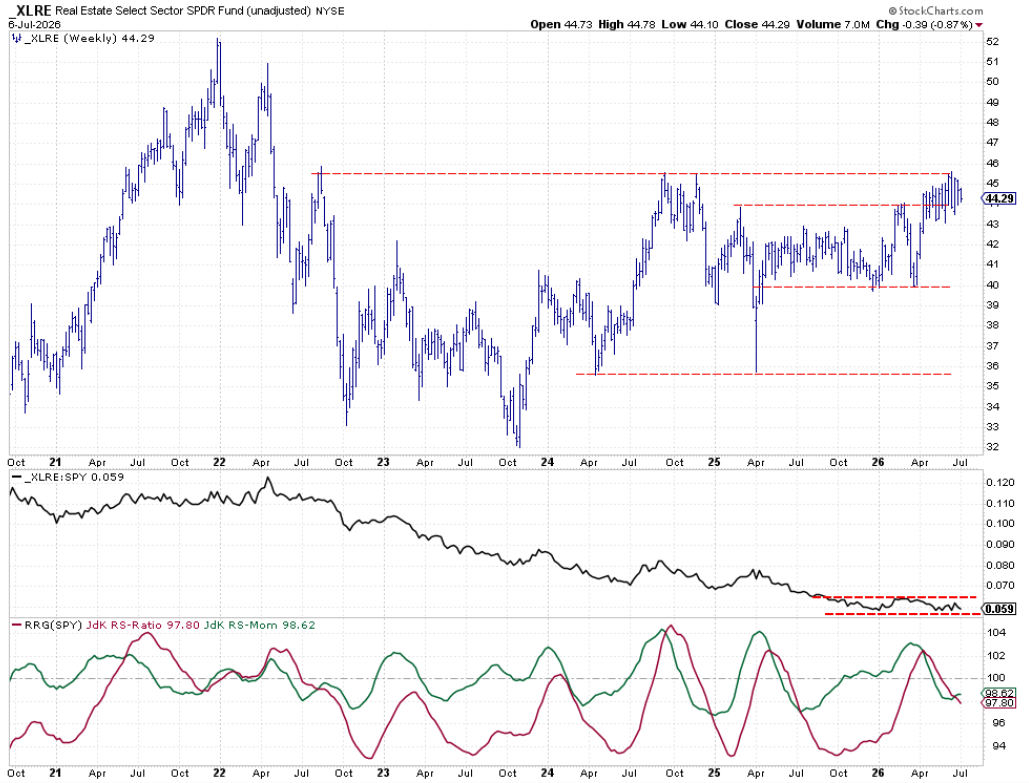
Real Estate is stuck near a resistance level around 4,550 points, with solid support near 4,350. The raw strength line is flat, but momentum is finally rising, which could help break the ceiling.
Materials
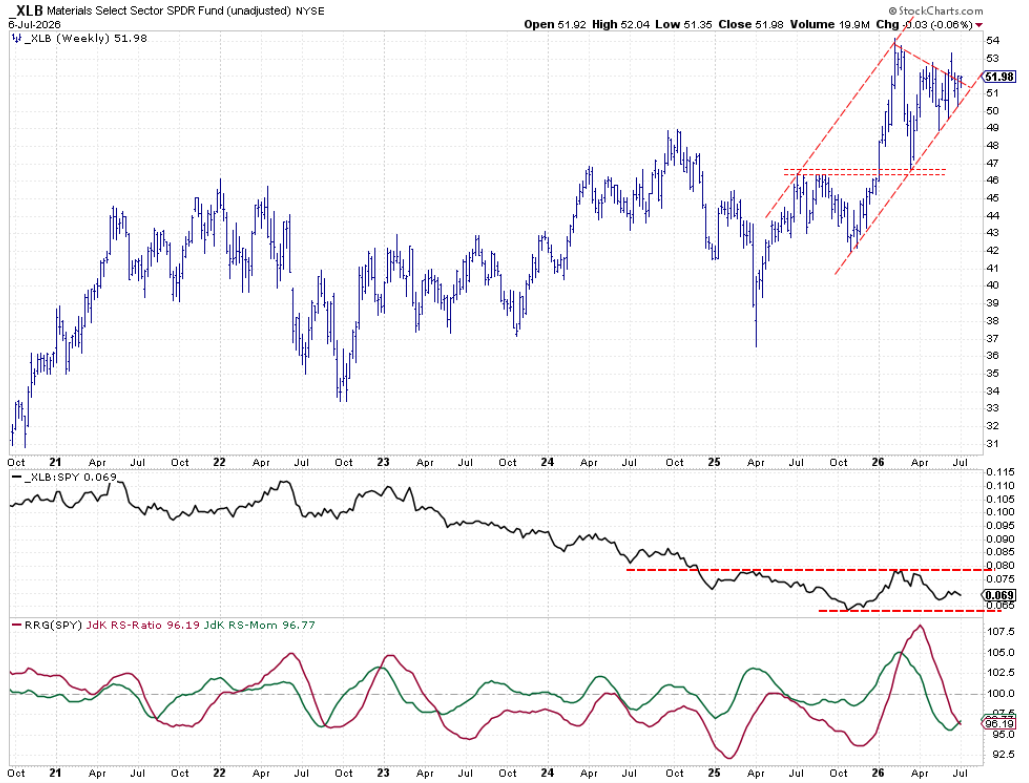
Materials are still in a consolidation triangle. Strength is flat, but momentum is beginning to curl upward. A small push could send the sector higher.
Financials
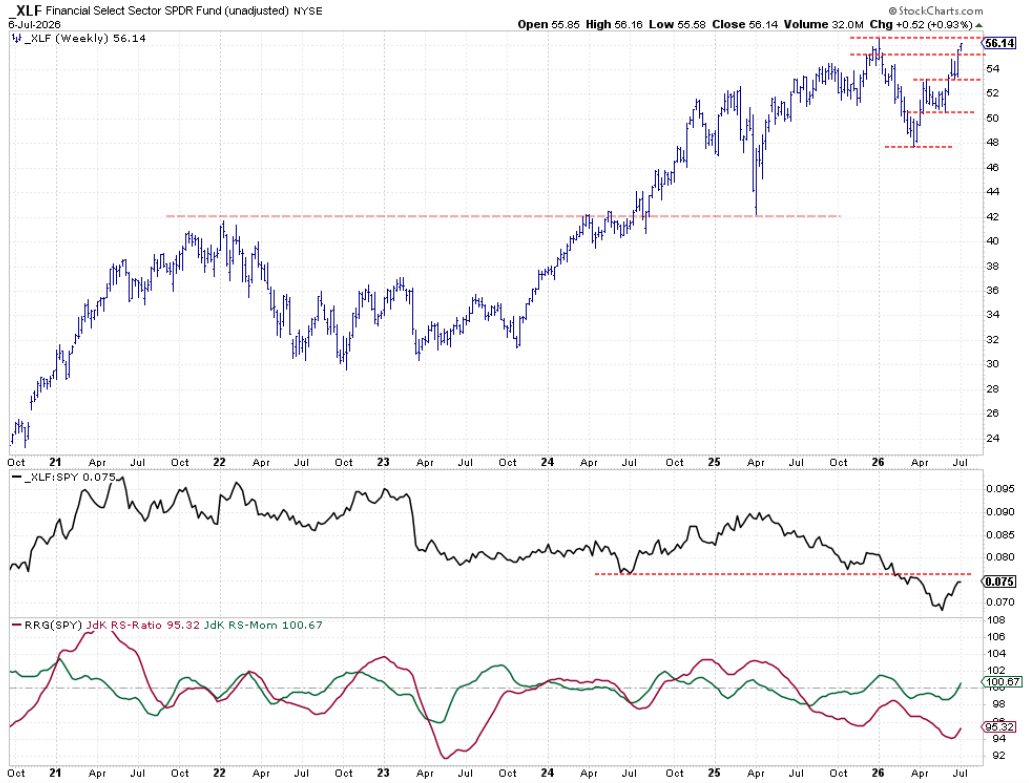
Financials have entered the top‑five group. The price chart is moving higher, testing a recent high near 5,650. Strength is near an old support level that could act as new resistance. If the sector breaks above it, more improvement is likely.
Portfolio Performance

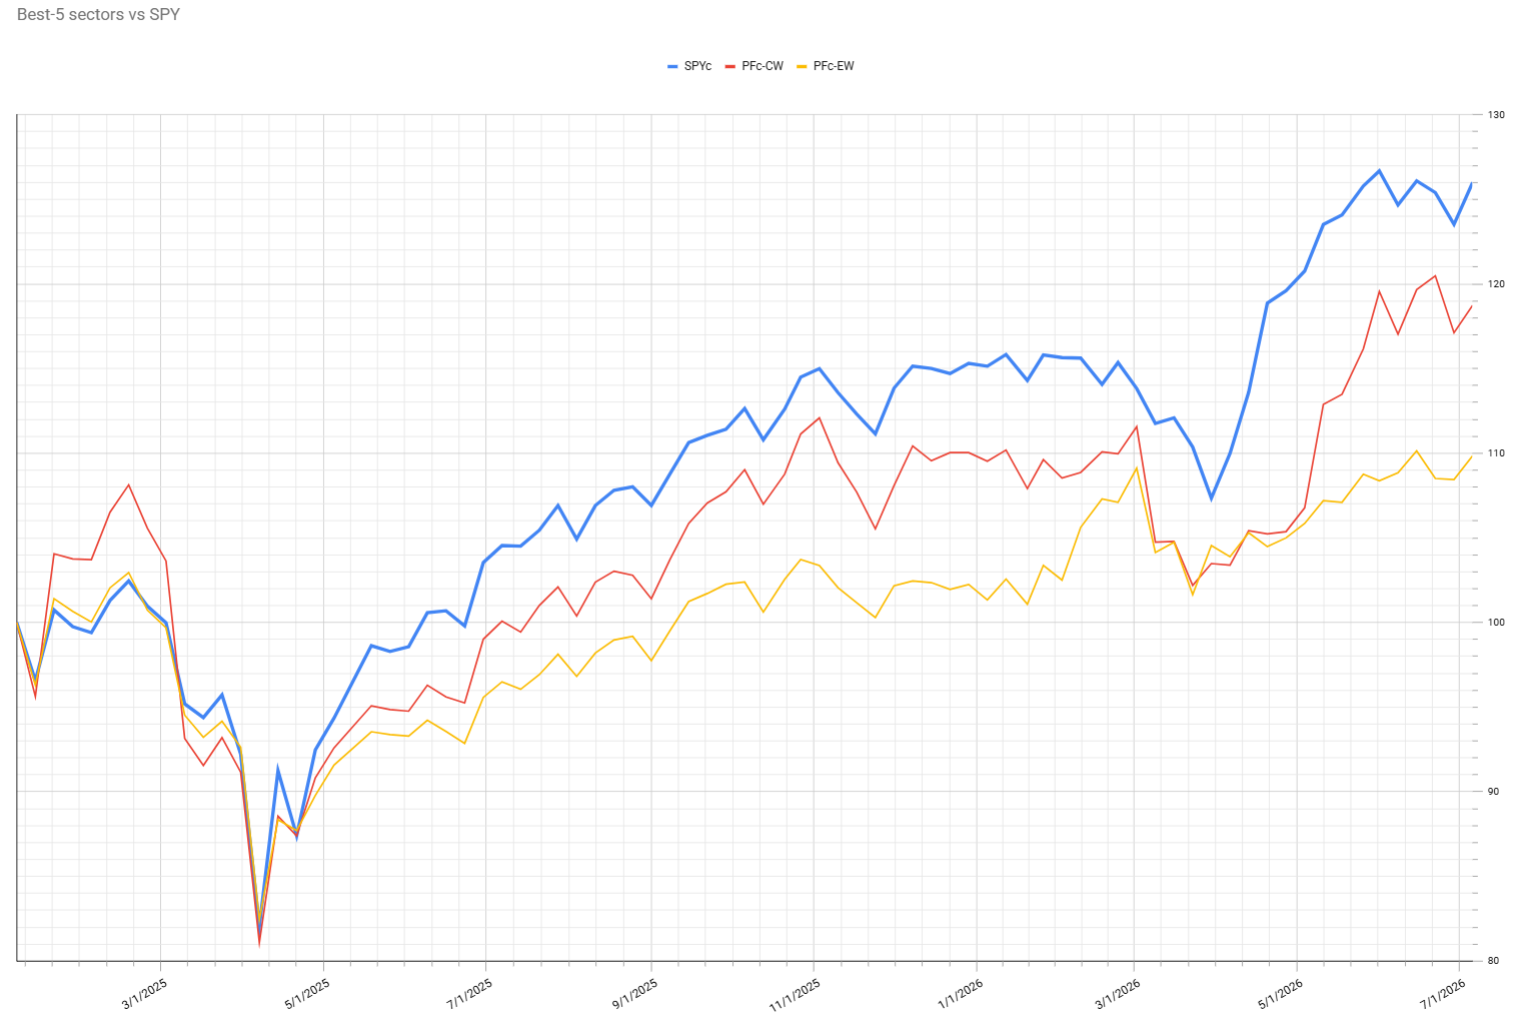
The portfolio is holding steady compared with last week but still trails the S&P 500 by about 6% since it began. That gap is normal when a strategy sticks to a few sectors while others, like Technology, race ahead.
Stay alert and keep watching the sector moves.
Source: Materials provided by https://articles.stockcharts.com.Note: Content may be edited for style and length.