
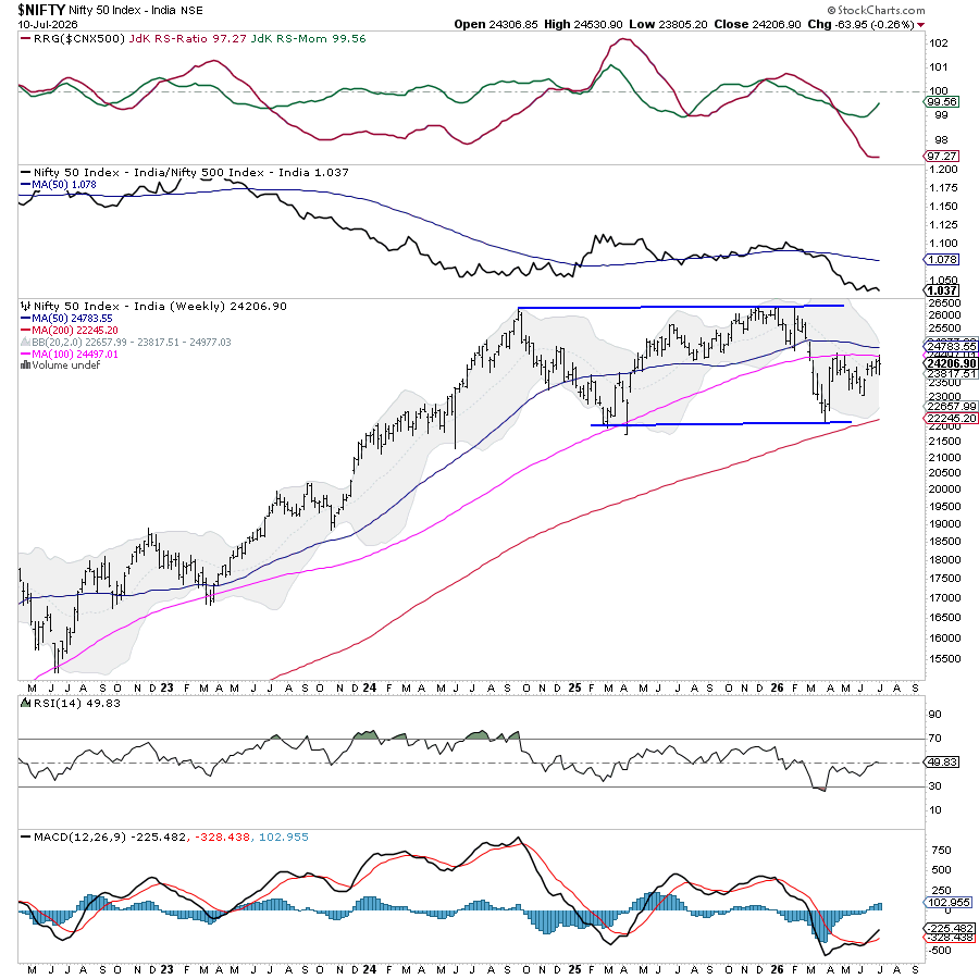
The market moved in a narrow band this week. The Nifty index stayed between 23,800 and 24,530 points. It closed the week a little lower at 24,206.90, down 0.26%.

Volatility, measured by the India VIX, rose about 4% to 12.25. This shows that traders expect a little more price movement, even though the index stayed flat.
The longer‑term trend is still flat. The 100‑week moving average sits at 24,498, acting as a strong barrier. The index has not been able to stay above this level. Below that, the 23,800‑24,000 zone offers solid support and is helping the market hold its recent gains.
Key levels to watch next week are:
- Resistance: 24,500 and 24,650
- Support: 24,000 and 23,800
Technical indicators are neutral. The weekly RSI is about 50, showing no clear overbought or oversold condition. Momentum is balanced, and the MACD stays above its signal line. The latest price candle is small, indicating indecision.
Overall, the Nifty is trapped in a consolidation pattern. It keeps defending long‑term support but meets resistance near the 100‑week average. The 50‑week average at 24,783 lines up with the top of the current range, making 24,500‑24,800 a crucial area. Without a clear break, the index will likely stay range‑bound with occasional spikes.
For traders, the safest plan is to pick strong individual stocks rather than chase the index. Keep risk low, protect gains, and watch for a decisive breakout before adding more directional bets.
Sector Analysis for the Coming Week
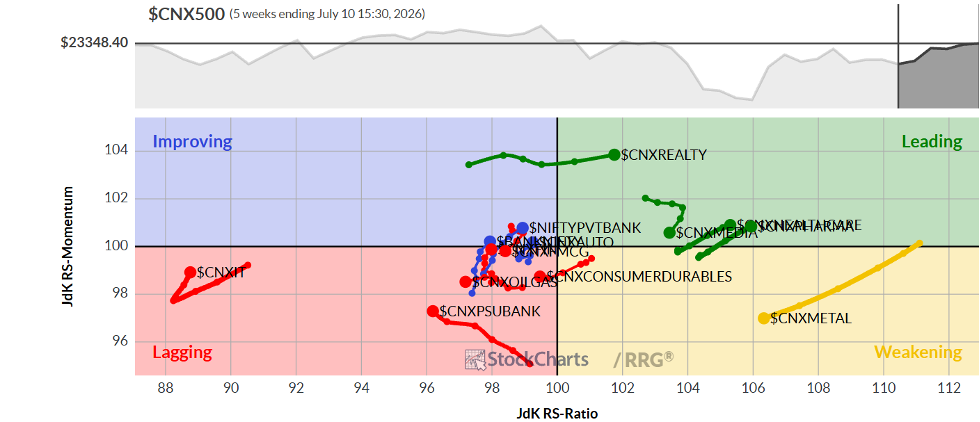
Using Relative Rotation Graphs, we compared each sector to the CNX500 (Nifty 500) index, which covers over 95% of the market’s free‑float value.
The chart shows:
- Pharma, Mid‑cap, Media, and Realty are in the leading quadrant – they may beat the broader market.
- Infrastructure, PSE, Metal, and Energy sit in the weakening quadrant – they could lag behind.
- FMCG, IT, PSU Bank, Services, and Financial Services are in the lagging quadrant, but many are gaining momentum.
- Auto and BankNifty are now in the improving quadrant, suggesting they are starting to outperform.
Traders should stay selective, focus on stocks with clear strength, and wait for a firm breakout before increasing exposure to the Nifty.
Source: Materials provided by https://articles.stockcharts.com.Note: Content may be edited for style and length.