

It is easy to get excited when a price gets close to a big barrier. Many traders hope the price will smash through and keep climbing. Smart traders know they should wait for a real breakout and a follow‑up move before acting.
Below are three charts that are near strong resistance levels. They look powerful, but they still need a confirmed break to show a new uptrend.
DoorDash Inc. (DASH)
For the past four months DoorDash bounced between $145 and $150. In mid‑June it pushed higher and now sits near a key resistance zone.
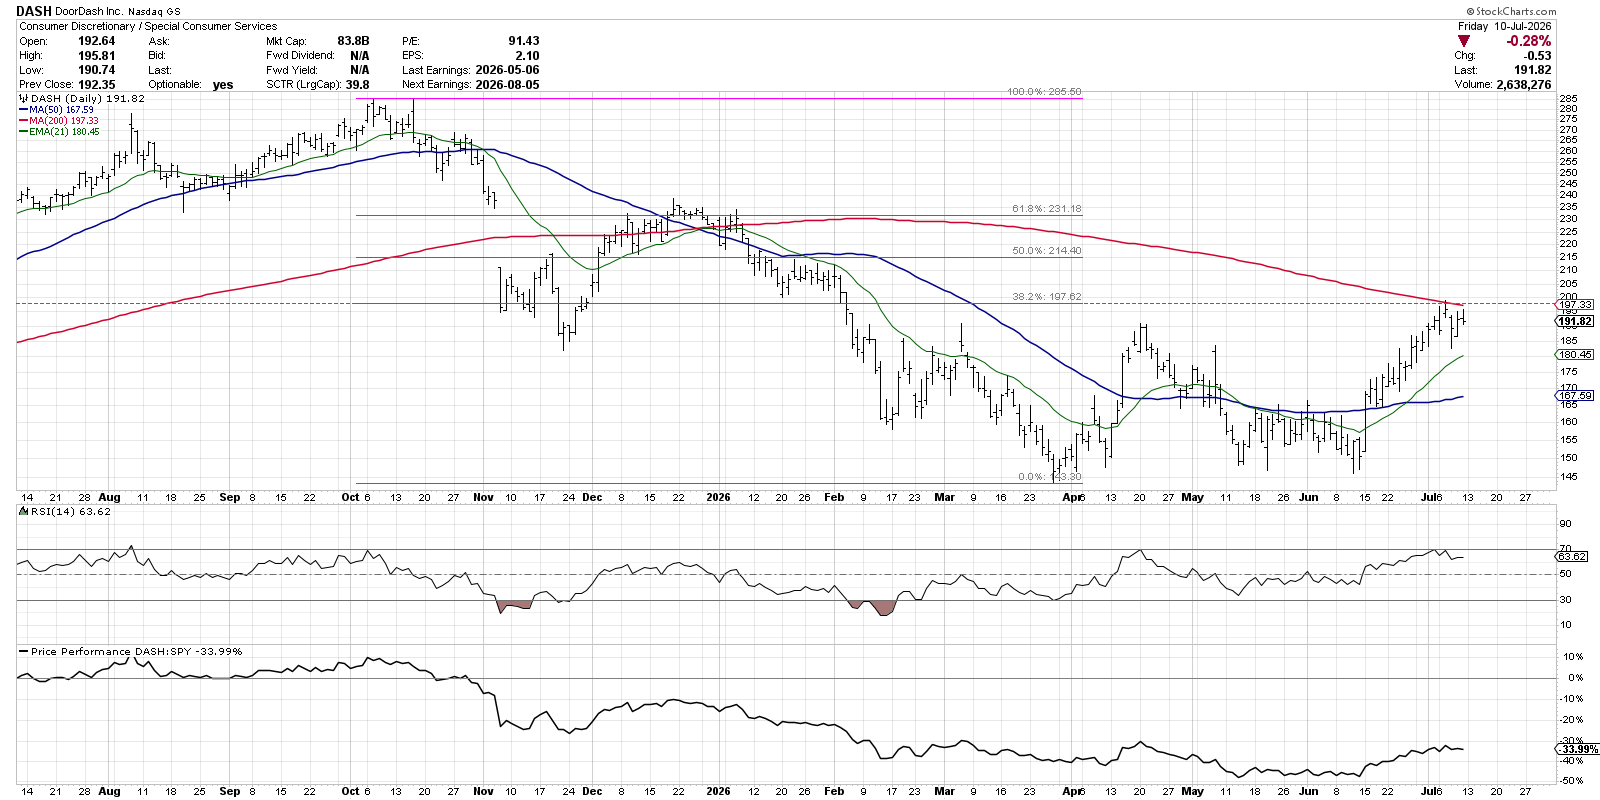
The 200‑day moving average lines up with the 38.2 % Fibonacci level, making $198 a strong ceiling. If the price closes above $198 and stays higher, it would signal a new buying phase. Without that close, the stock stays in a wide‑range consolidation.
SPDR S&P Aerospace & Defense ETF (XAR)
During 2026 XAR has formed a rectangle on the chart. Support and resistance are fairly even, so buying and selling are balanced.
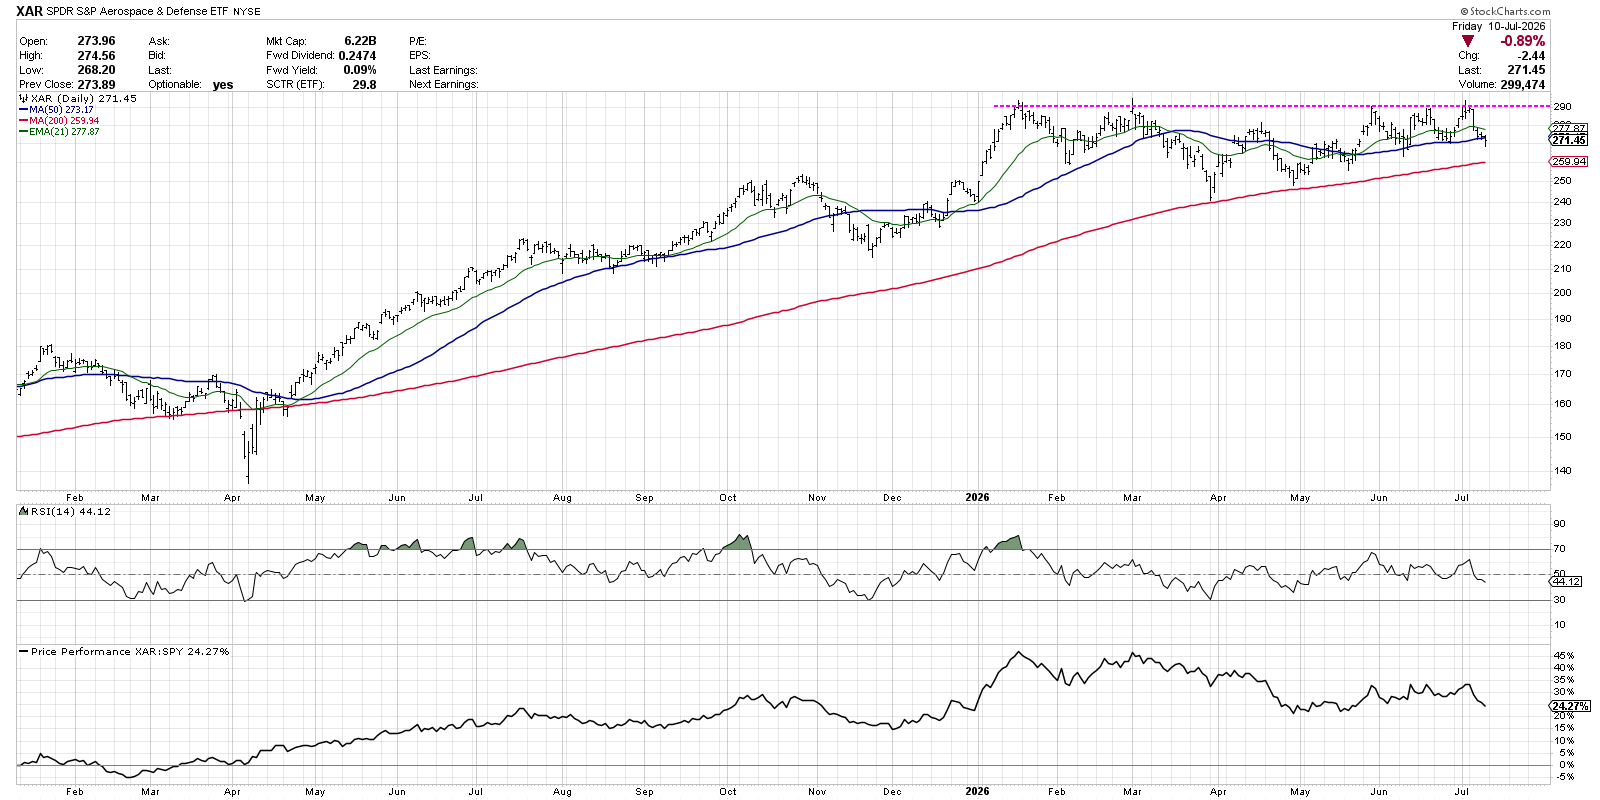
Traders watch for a “big base breakout.” If the price moves above $290 with good volume, a new uptrend may start. Until that happens, the ETF remains in a sideways pattern.
Defiance Quantum ETF (QTUM)
QTUM trades between $150 (support) and $170 (resistance). The RSI is sitting in a neutral zone (40‑60), showing little conviction.
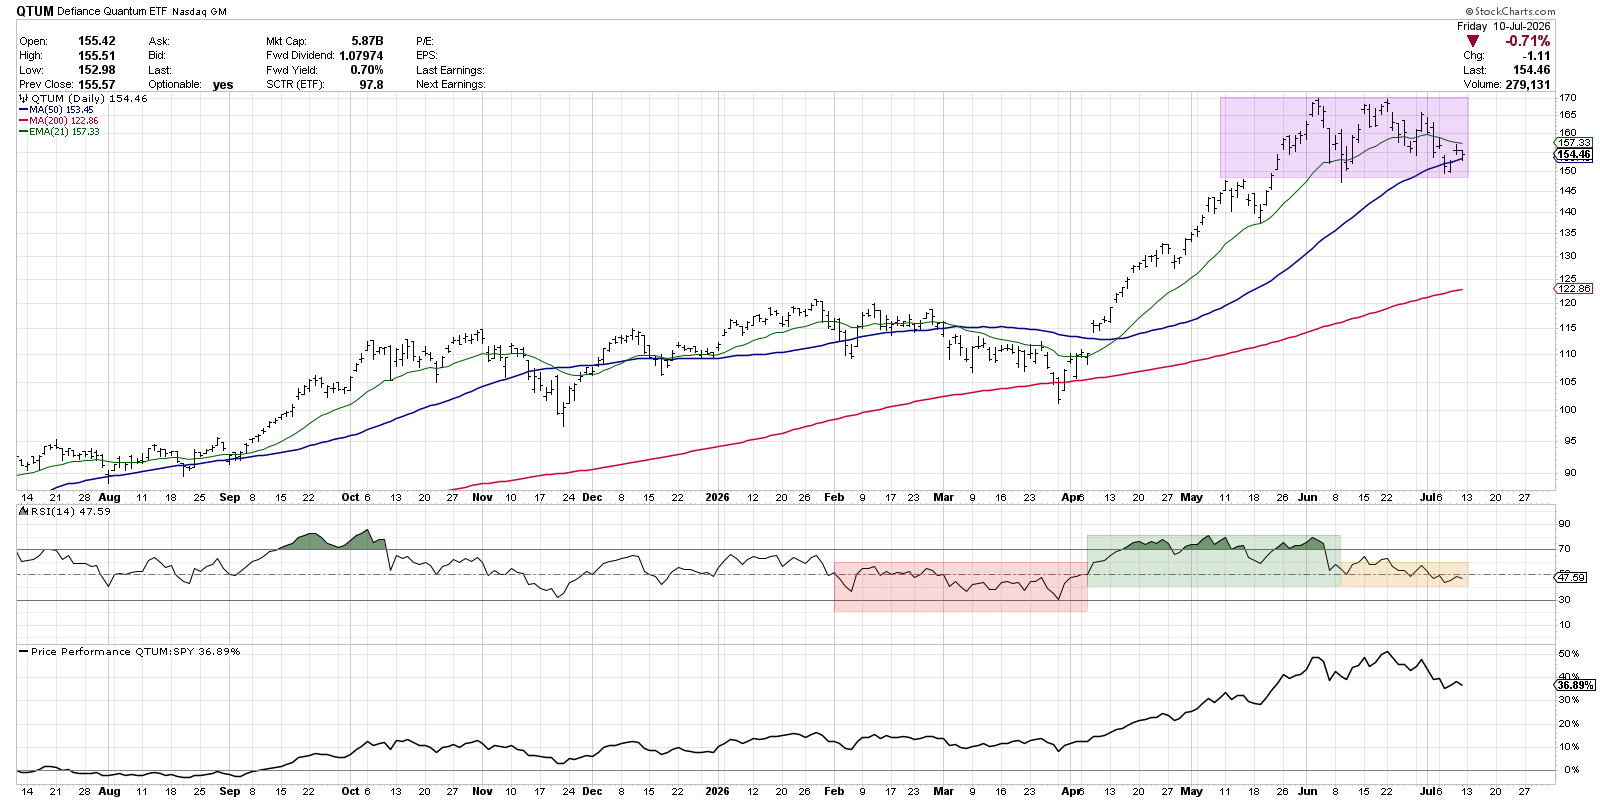
The range could end either way. The key is to watch for a clear price break and then confirm it with strong momentum. That helps catch the next big move.
Remember: don’t force a trade. Let the price tell you when the opportunity is real.
Disclaimer: This material is for educational purposes only and does not constitute financial advice. Always consider your personal situation and consult a professional before investing.
Source: Materials provided by https://articles.stockcharts.com.Note: Content may be edited for style and length.