
Gold fell a lot after hitting a high in late January. The drop makes many think the price could bounce back and maybe even set a new record.
Gold Looks Too Cheap
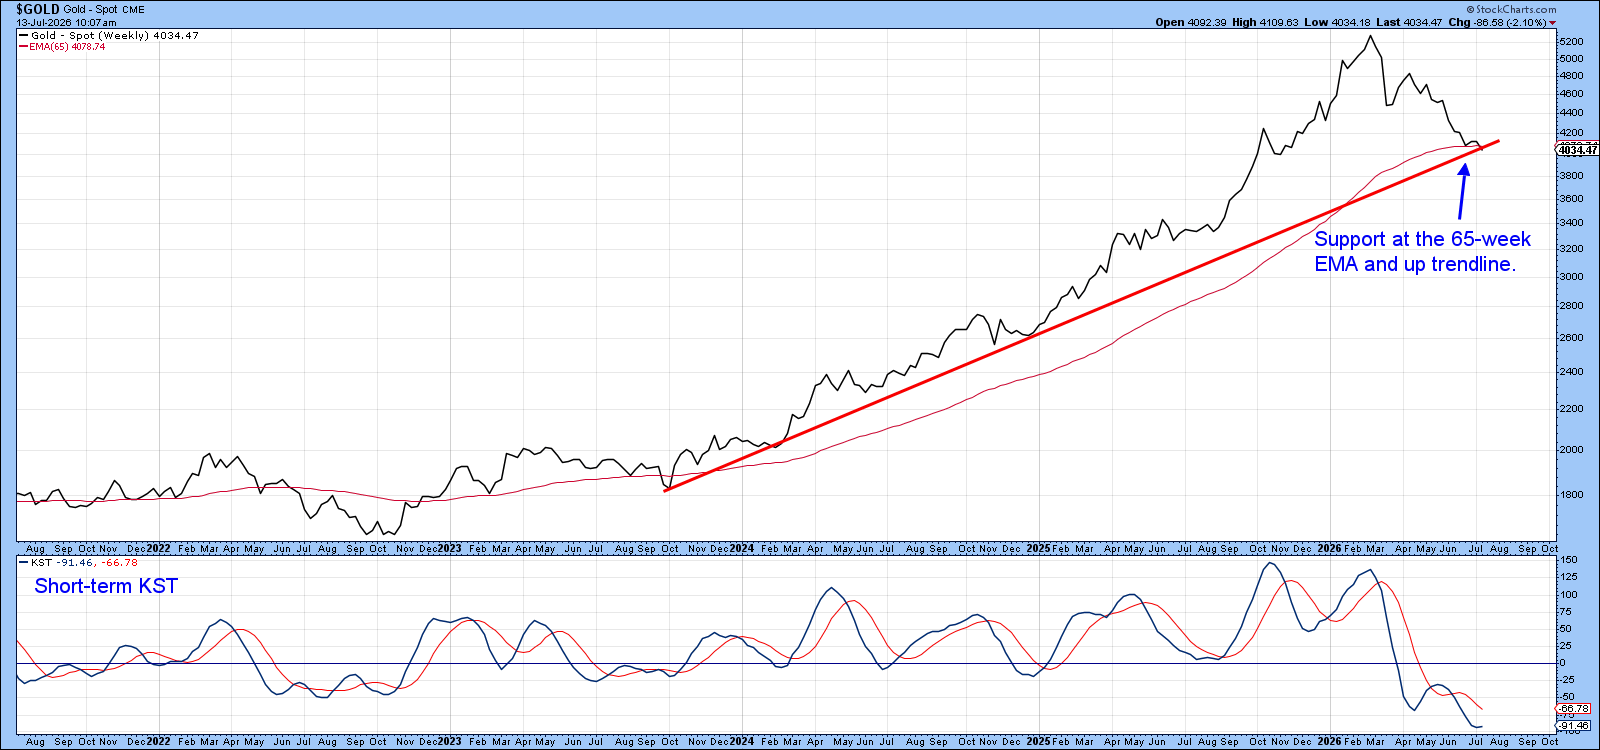
On a weekly chart, gold is now near a strong support line made by its 65‑week exponential moving average (EMA). An up‑trend line that started in late 2023 also meets this EMA, adding extra support.
When a market slides fast, the support level becomes more important because much of the selling pressure has already been used up. Think of it like a runner trying to break through a door: if they start close, they hit the door hard; if they start far away, they are tired and may bounce back.
The same idea may be happening with gold. The recent fall has taken out a lot of the selling energy, leaving the market weaker as it reaches the support zone. A short‑term indicator called the Know Sure Thing (KST) shows the market is deeply oversold, which often precedes a rebound.
But what kind of move could we see? It might be a quick bounce, a climb to new highs, or a long period of flat trading while the market digests the previous rise. To decide, we need to look at the bigger technical picture.
A Strong Sell Signal Appeared
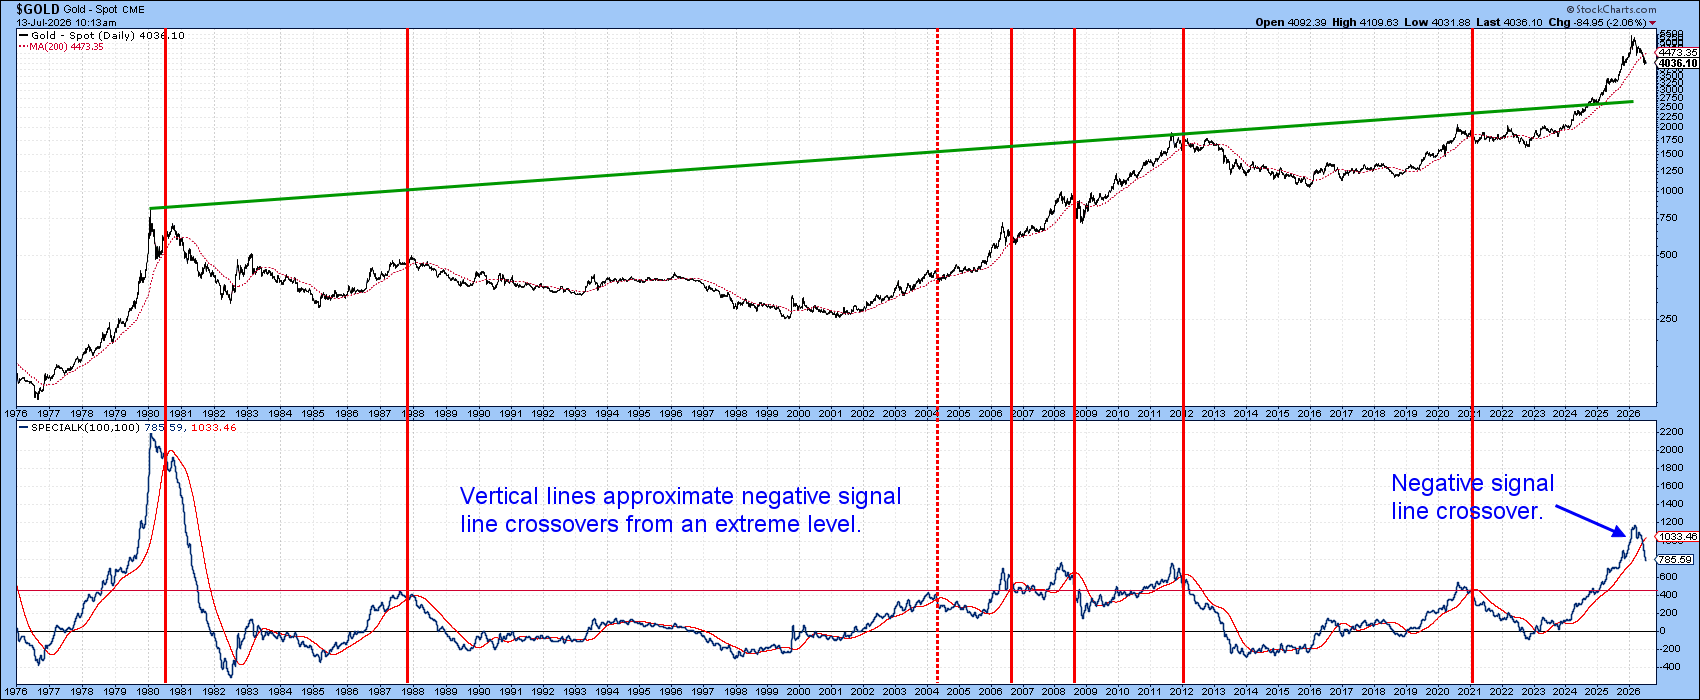
Another chart compares gold to a “Special K” (SPK) indicator that dates back to the mid‑1970s. The chart highlights moments when the SPK fell below its signal line after being high above a red line that signals an over‑bought market.
The latest crossing, which happened last month, is the seventh clear negative signal since 1980 and came from the highest SPK reading since the 1980 peak.
History shows mixed results: sometimes the signal only caused a brief pause, other times it started a long decline. Big negative signals usually show up after a period of strong enthusiasm, which often takes time to unwind.
We can’t know for sure what will happen, but odds suggest gold could face a tougher environment for the next couple of years.
Silver Mirrors Gold’s Situation
Silver often moves with gold over the long run. Its technical picture now shows similar warning signs.
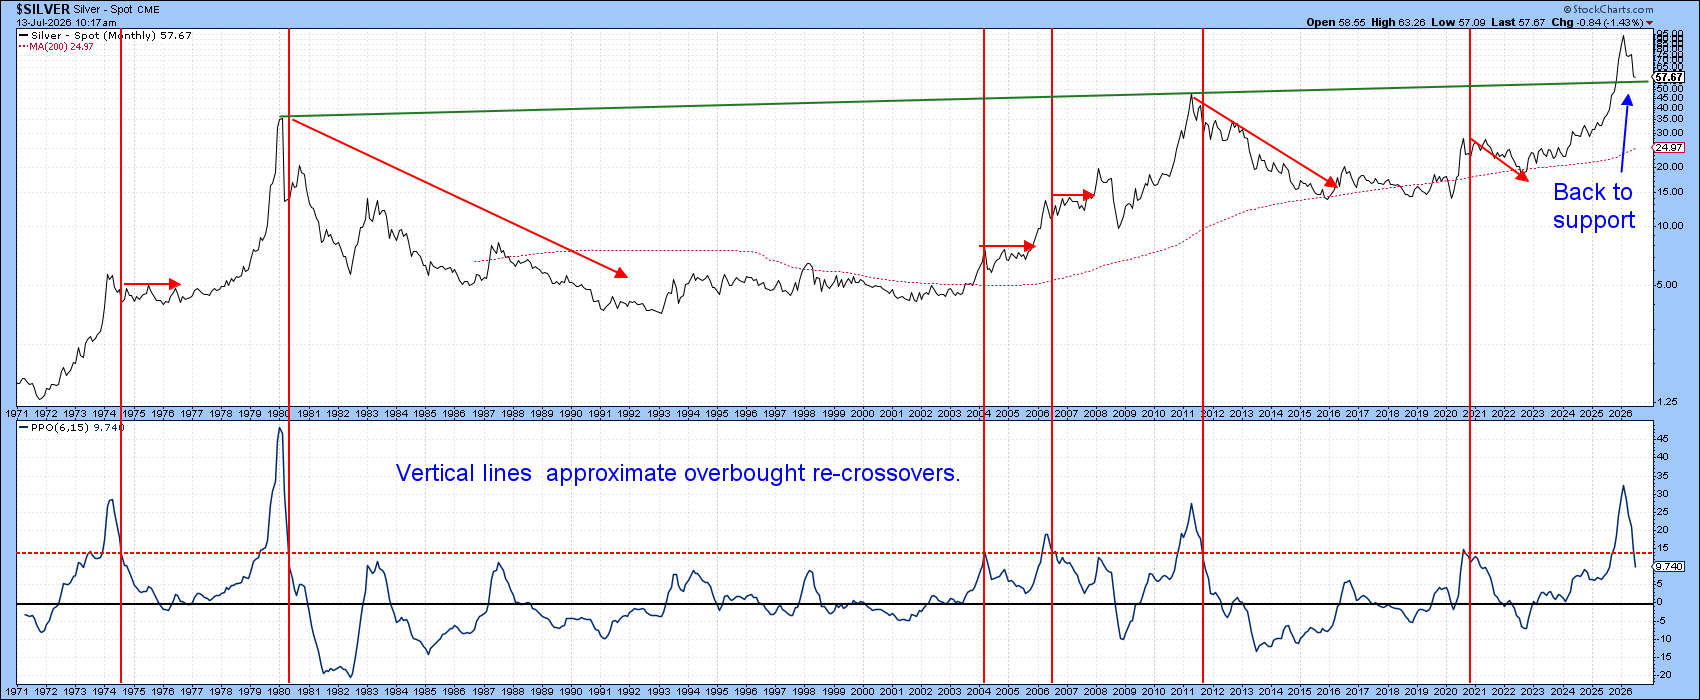
A monthly Price Percentage Oscillator (PPO) chart for silver back to 1971 shows the indicator crossing above an over‑bought line six times before, each time followed by a long pause or a downtrend. A seventh crossing happened earlier this year.
Like gold, silver is also deeply oversold on a short‑term basis, meaning much of the recent selling may be done. It is trading just above a key support line made by a long‑term green trendline that used to be resistance, which can now act as support.
These points suggest silver may stay weak over the long run but could see a short‑term bounce.
Bottom Line
Past patterns suggest both gold and silver have likely topped recently. The longer‑term view points to a period of sideways or falling prices, making a new high unlikely for the next two to three years. For now, the technical signs favor a modest recovery rally.
Source: Materials provided by https://articles.stockcharts.com.Note: Content may be edited for style and length.