

Investors are getting ready for a wild Q2 earnings period. The VIX looks calm at about 15, but hidden under the market surface, many single stocks are shaking a lot.
The VIXEQ index, which tracks stock‑specific volatility, is close to its yearly high at 48.97. This big gap between VIX and VIXEQ shows that many stocks could swing a lot in the coming weeks. Traders may want to shrink position sizes before the earnings rush starts on Tuesday.
Catalyst‑Packed Tuesday
Big banks will release earnings on Tuesday morning, except for BNY Mellon and Morgan Stanley. Later that day, June CPI data will be released and the Fed chair will testify to Congress. All of these events can push the market higher or lower.
For long‑term investors the news may not matter much, but active traders should look for stocks that are already strong. Using a scanner, three groups of stocks show the best relative strength and are near their 52‑week highs.
Railroads Keep Rolling
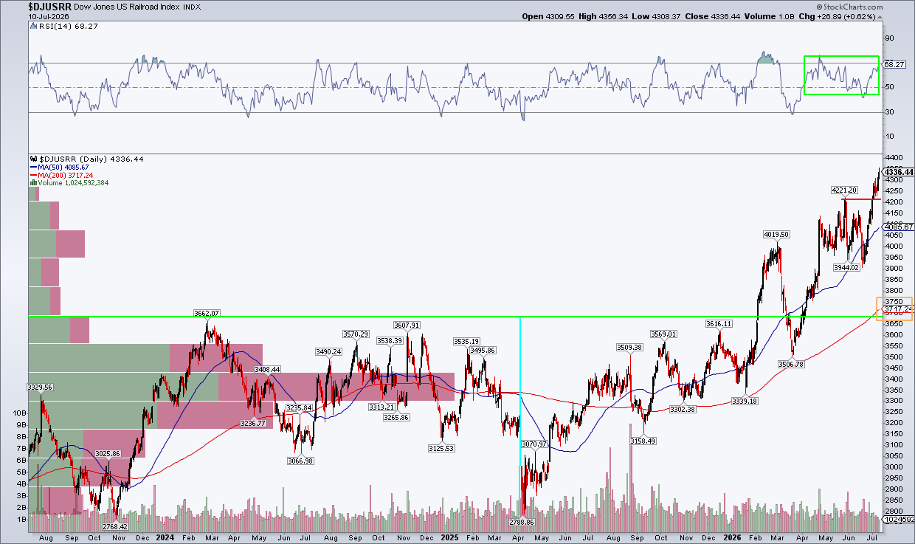
The Dow Jones US Railroad Index hit a record high last Friday. Leaders such as CSX, Norfolk Southern and Union Pacific are all reporting earnings this week.
The index has broken out of a multi‑year base and now sits above a key resistance level. The RSI is above 40, indicating bullish momentum, but the price is a bit stretched above the 200‑day moving average.
Refiners Enjoy Wide Crack Spreads
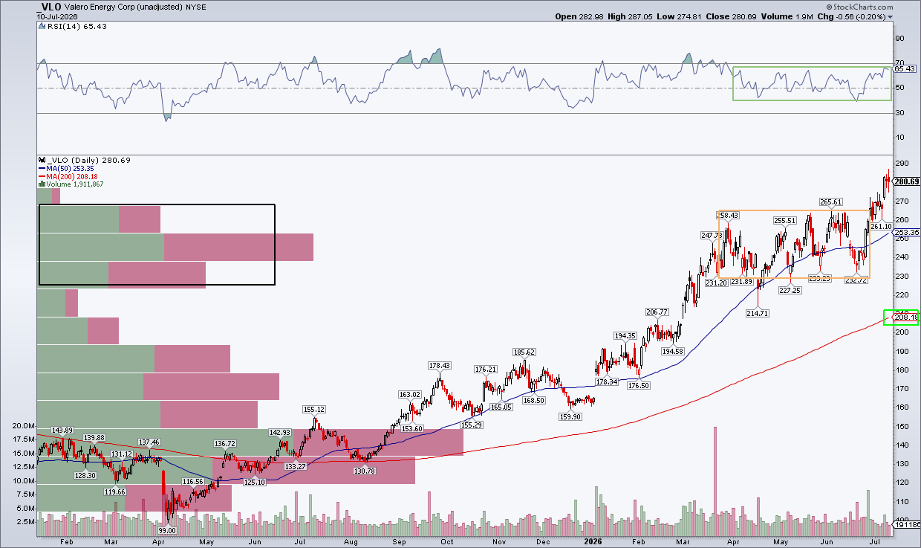
Energy refiners benefit from a large price gap between crude oil and finished products. Marathon Petroleum, Phillips 66 and Valero Energy rank high on the strength score.
Valero (VLO) is the oldest of the three. Its chart shows a tight range from March to June, then a breakout that could push the price toward $305‑$310. Volume is building below the current level, which may help support a pull‑back.
Retail Shows Quiet Strength
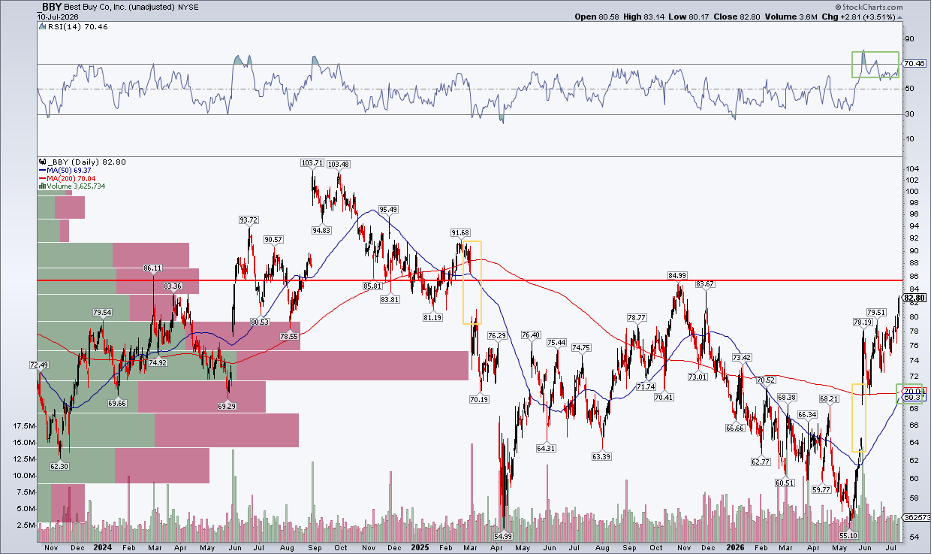
Some retail names are waking up. Best Buy hit a new one‑year weekly high, and Target has been climbing since late last year. The broader retail ETF is still choppy, but pockets of strength appear.
Best Buy still faces resistance near $85, and a lot of old price gaps sit above today’s level. However, a bullish golden‑cross pattern should appear right before its earnings report on August 19.
Bottom Line
Chip stocks are jumping a lot, so looking at other sectors can help manage risk. Railroads and refiners show strong momentum, while some retail names are gaining before the back‑to‑school shopping wave. Keep position sizes modest and watch earnings dates closely.
Disclaimer: This content is for education only and does not constitute financial advice.
Source: Materials provided by https://articles.stockcharts.com.Note: Content may be edited for style and length.