

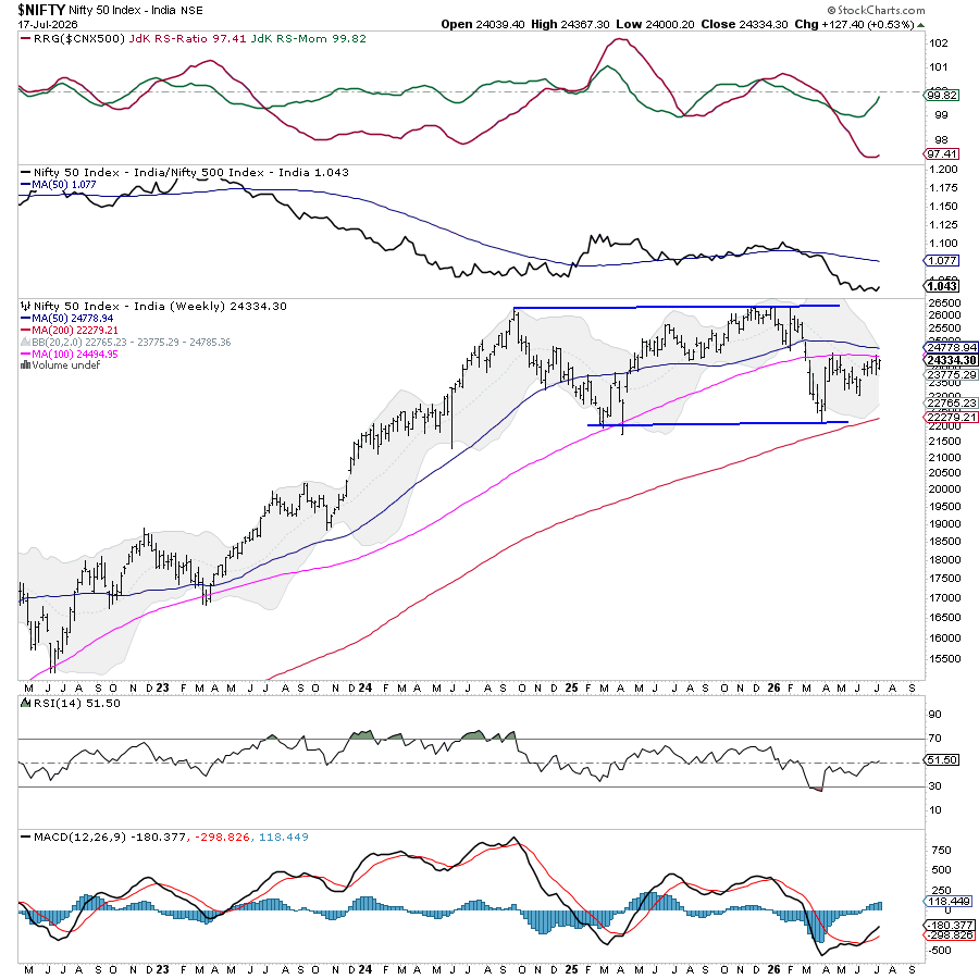
The Indian stock market moved inside a narrow range this week. The Nifty 50 index bounced between 24,000.20 and 24,367.30, ending the week with a small gain of 127.40 points (about 0.53%). The India VIX rose about 7% to 13.15, showing a little more volatility.
Even though the market did not show strong direction, the overall technical picture stays positive. The index defended the 23,800‑24,000 zone, making it a key support level and a base for the current rebound. With the market now stabilising, the next hurdle is near 24,500, where the 100‑week moving average sits. A clear break above 24,500 would boost the medium‑term outlook.
Looking ahead, the market is likely to start the week calmly but with a positive tone. Immediate resistance is expected at 24,500, followed by 24,780. On the downside, 24,000 and 23,800 act as important support, with 23,800 being the main line of defence for bullish traders.
The weekly Relative Strength Index (RSI) is 51.49, indicating a neutral stance. The MACD line sits above its signal line, and the latest candle is a small bullish body, suggesting continued buying after the recent pause.
Pattern analysis shows the index is still recovering after holding the lower edge of its broader range. The repeated defence of the 23,800‑24,000 zone gives it extra technical weight. However, the market now faces a supply area around 24,500, where the 100‑week average adds extra resistance.
Traders should stay balanced. The strong support improves the short‑term view, but the upcoming resistance may trigger profit‑taking. New aggressive buying is best reserved for stocks that show strong relative strength and improving technical setups, rather than chasing the index near its resistance.
As long as the Nifty stays above 24,000, the recovery bias remains. Still, a selective, stock‑specific approach is advisable, especially as price action approaches the 24,500 zone, which will likely decide the next move.
Sector Analysis for the Coming Week
Using Relative Rotation Graphs (RRG), we compared major sectors against the CNX500 (Nifty 500) index, which represents over 95% of the market’s free‑float capital.
The RRG shows that Real Estate, Pharma, Media, and the Mid‑Cap 100 index sit in the leading quadrant, indicating they are likely to outperform the broader market. Energy, Infrastructure, and Metals are in the weakening quadrant, suggesting slower relative performance.
The PSE (Public Sector) and Auto indices fall into the lagging quadrant, meaning they may underperform. The IT and PSU Bank indices are also lagging but are beginning to regain momentum.
Financial Services and the broader Bank Nifty have moved into the improving quadrant, pointing to a potential bounce.
Note: RRG charts display relative strength and momentum against the Nifty 500. They are not direct buy or sell signals.
Source: Materials provided by https://articles.stockcharts.com.Note: Content may be edited for style and length.