
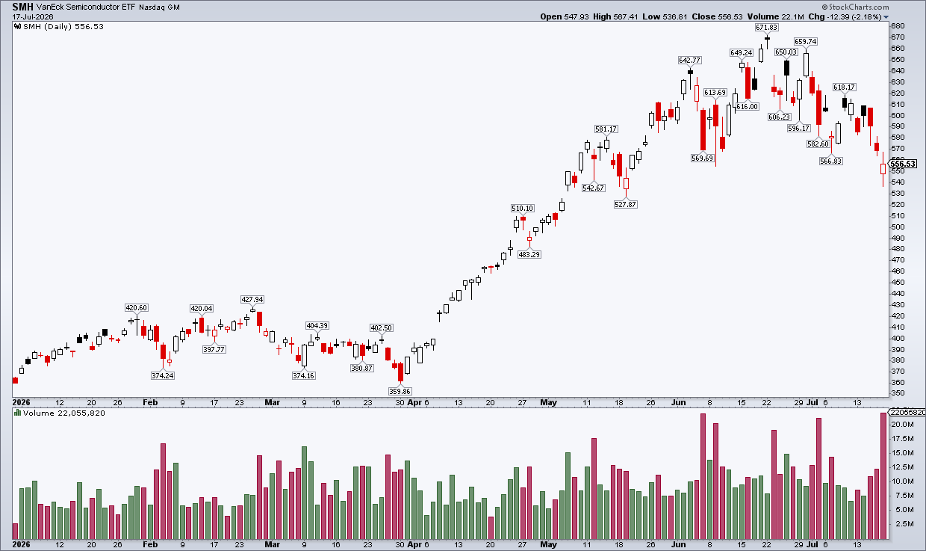
July was rough for many chip funds. The VanEck Semiconductor ETF (SMH) fell from its mid‑year high and slid into bear‑market territory before a small bounce on options expiration.
As excitement around AI cools, investors are looking for new places to earn returns. One area that keeps showing up is China.
Chinese equity ETFs have risen while the broader market slipped. The iShares China Large‑Cap ETF (FXI) is up about 13% since late June. Big names like Alibaba, PDD and JD.com have led the charge, with Alibaba jumping roughly 25% in July.
These moves show that China’s price strength is worth a second look.
Relative Strength Highlights
At first glance, FXI and the iShares MSCI China ETF (MCHI) look flat. Both sit near their 20‑day moving averages. Yet two relative‑performance charts tell a different story.
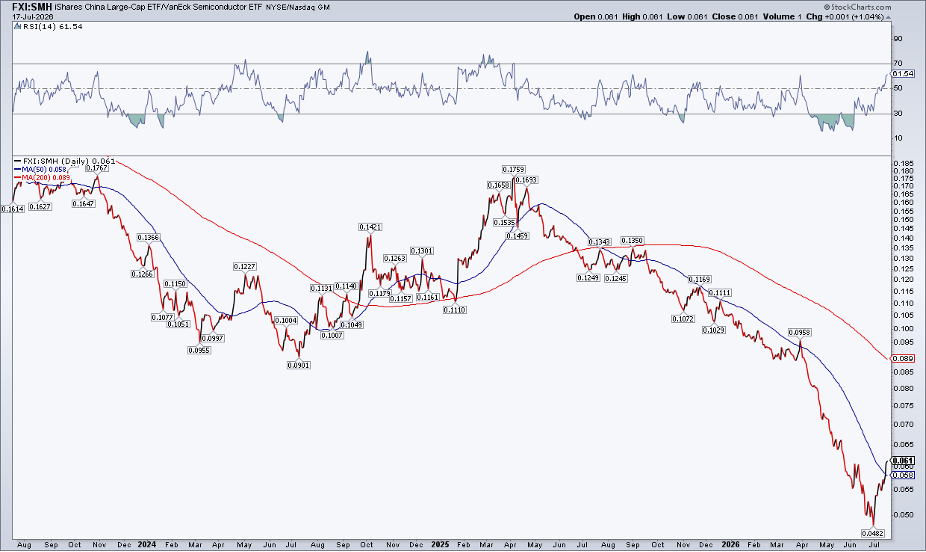
When we compare FXI to the semiconductor fund SMH, a clear V‑bottom forms. FXI has made a fresh two‑month high against global chip stocks. A 50‑day moving‑average line shows FXI:SMH is the furthest above that trend since early 2025.
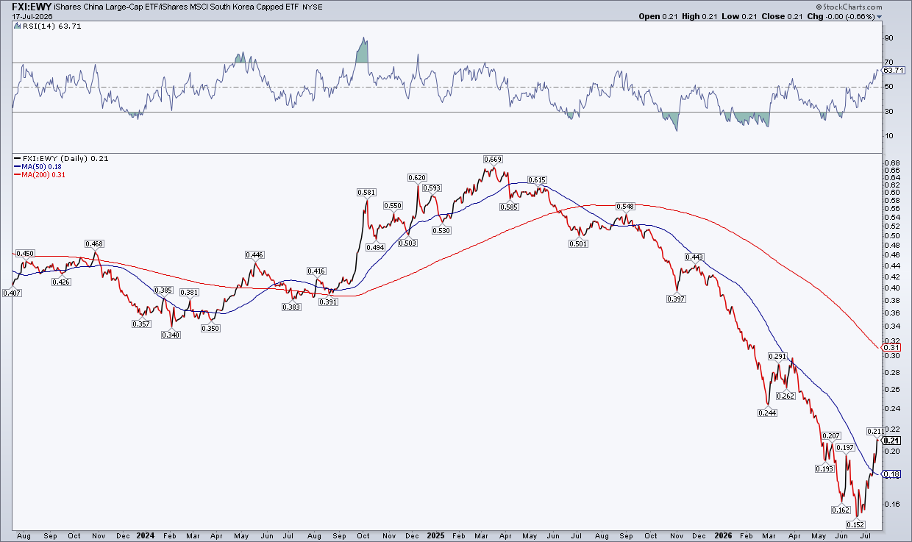
FXI also looks strong against South Korea’s EWY ETF. The FXI:EWY RSI line is making higher lows, a bullish sign that momentum is rising faster than price.
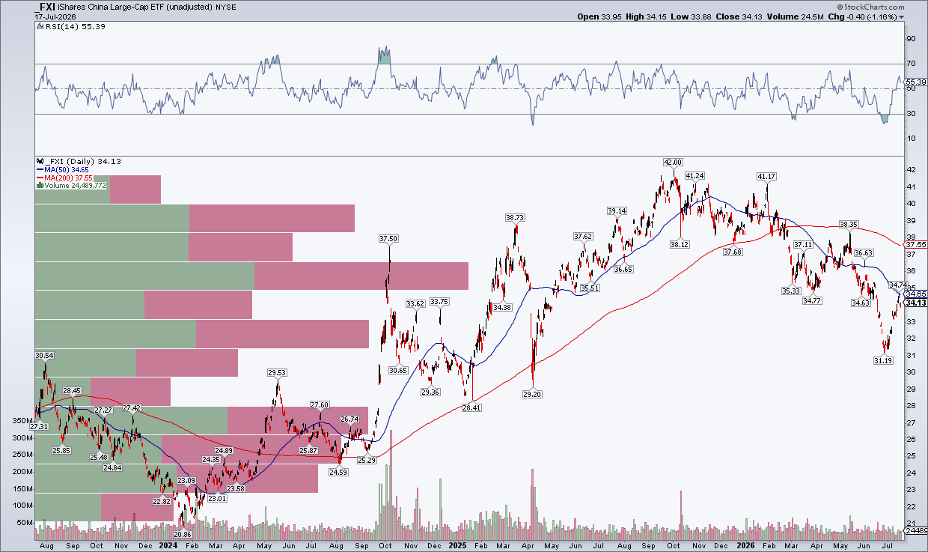
Even though these charts look promising, the overall trend for FXI is still down. Both the 50‑day and 200‑day moving averages are falling, and the ETF has been making lower highs and lower lows since last October.
Tools to Watch Global ETFs
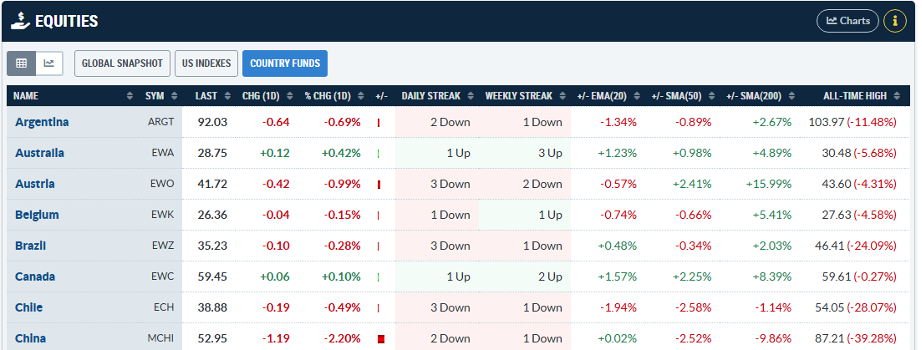
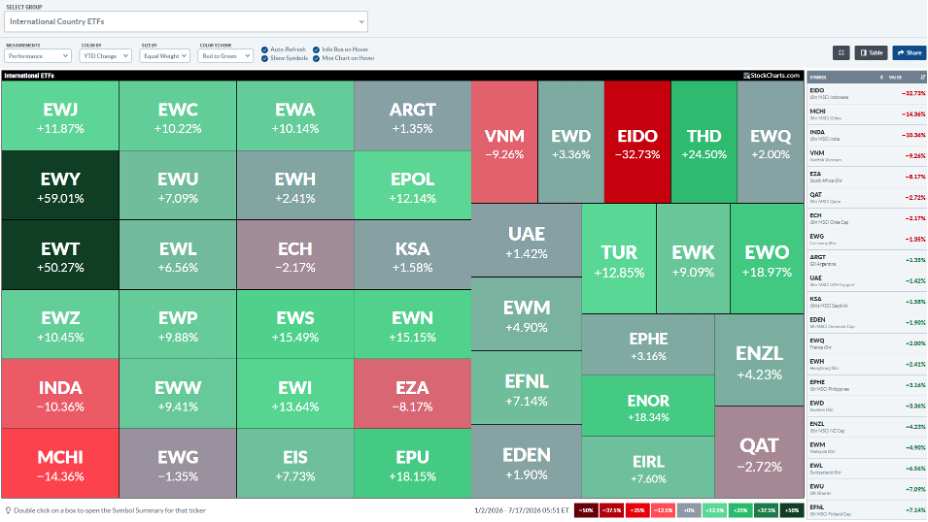
StockCharts offers a “Market Carpets” heat‑map that shows how major country ETFs are performing. Right now most squares are red, but China (MCHI) could turn green by month‑end, making it a potential standout.
Seasonality Matters
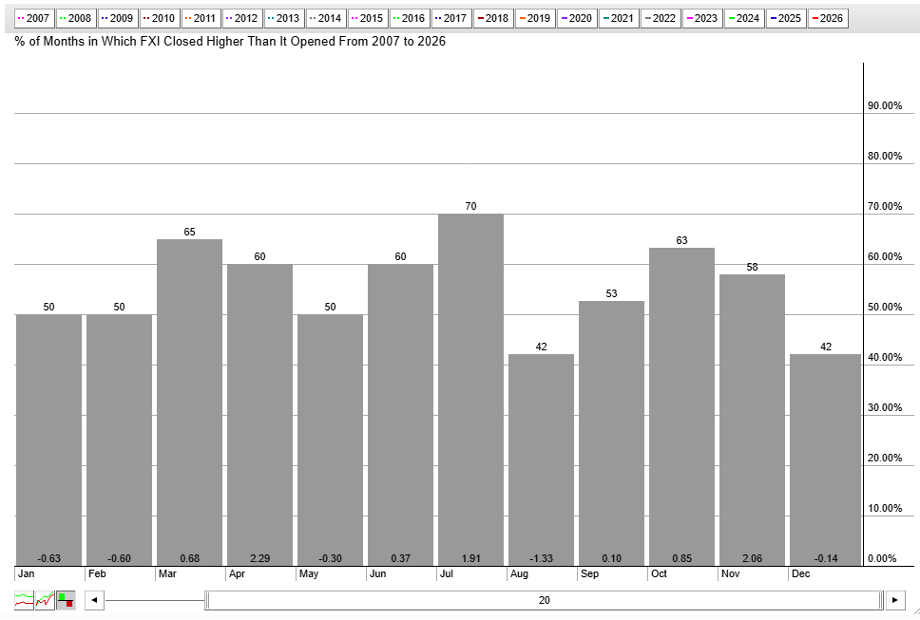
Historically, Chinese stocks tend to rise in the early part of the second half of the year. Since 2007, July has delivered an average gain of 1.9% and closed higher about 70% of the time. August and September are usually tougher, with more volatility.
Bottom Line
As AI chip funds lose steam, China ETFs are catching a wave of investor interest. Both FXI and MCHI have shown solid July strength after a long decline. While the market is not fully bullish yet, adding a modest China position could improve diversification for the rest of the year.
Disclaimer: This article is for educational purposes only and does not constitute financial advice. Consult a qualified professional before making any investment decisions.
Source: Materials provided by https://articles.stockcharts.com.Note: Content may be edited for style and length.