


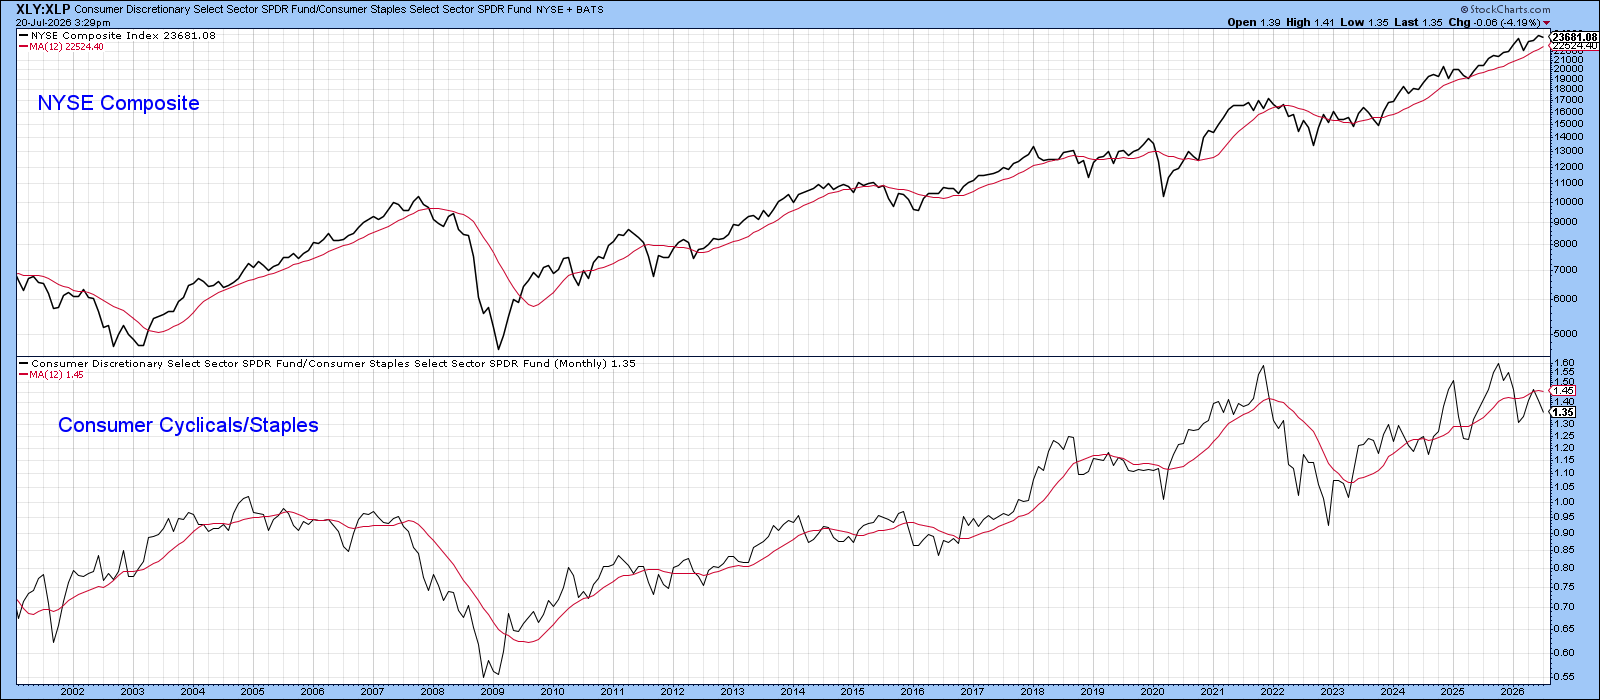
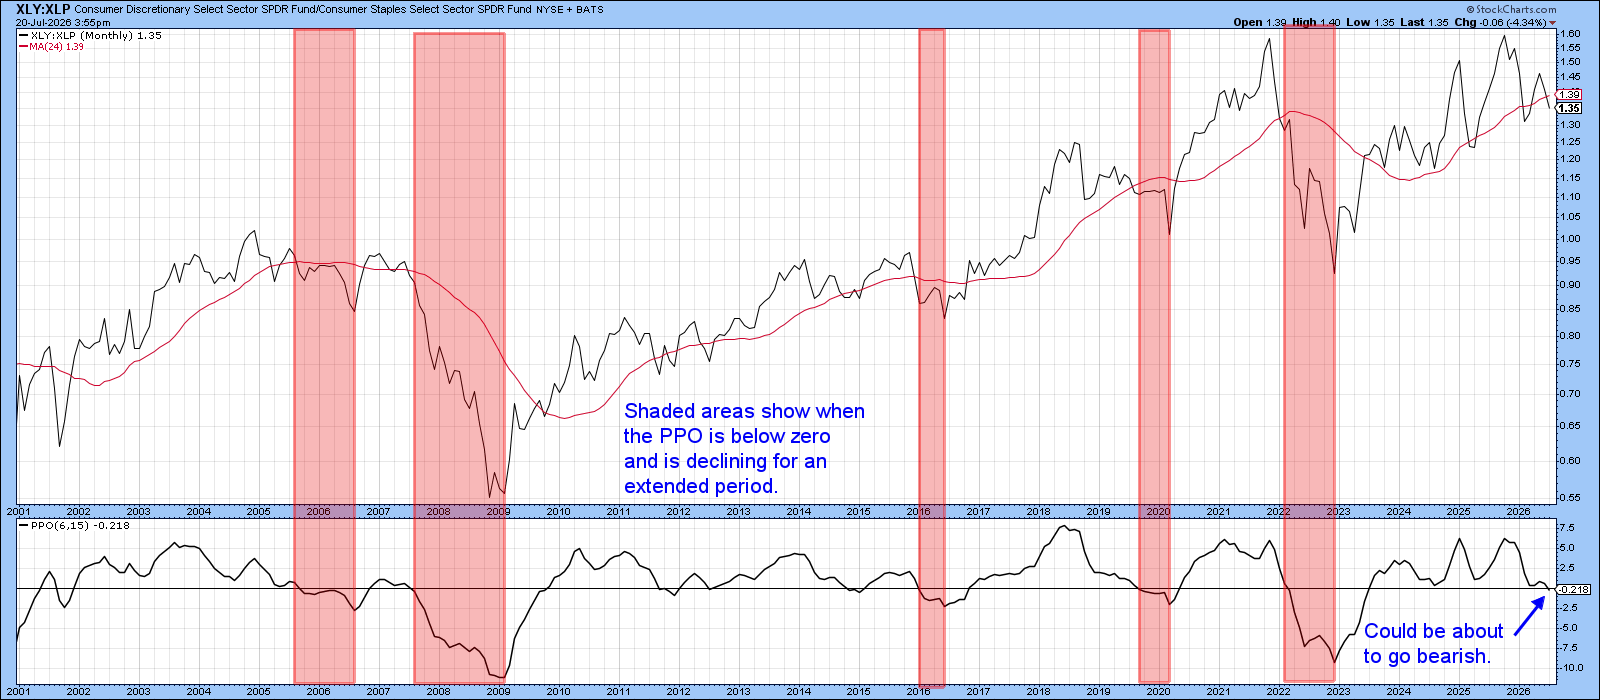
The stock market rises and falls based on how confident people feel about spending. A quick way to gauge this feeling is to look at the ratio of Consumer Discretionary stocks (XLY) to Consumer Staples stocks (XLP). When the ratio goes up, shoppers are willing to buy non‑essential items. When it drops, they focus on basics.
Historically, a higher XLY/XLP ratio has matched strong bull markets, while a lower ratio often appears before market drops. Because the line is jagged, it’s tough to read the exact reversal points by just comparing it to the NYSE Composite ($NYA).
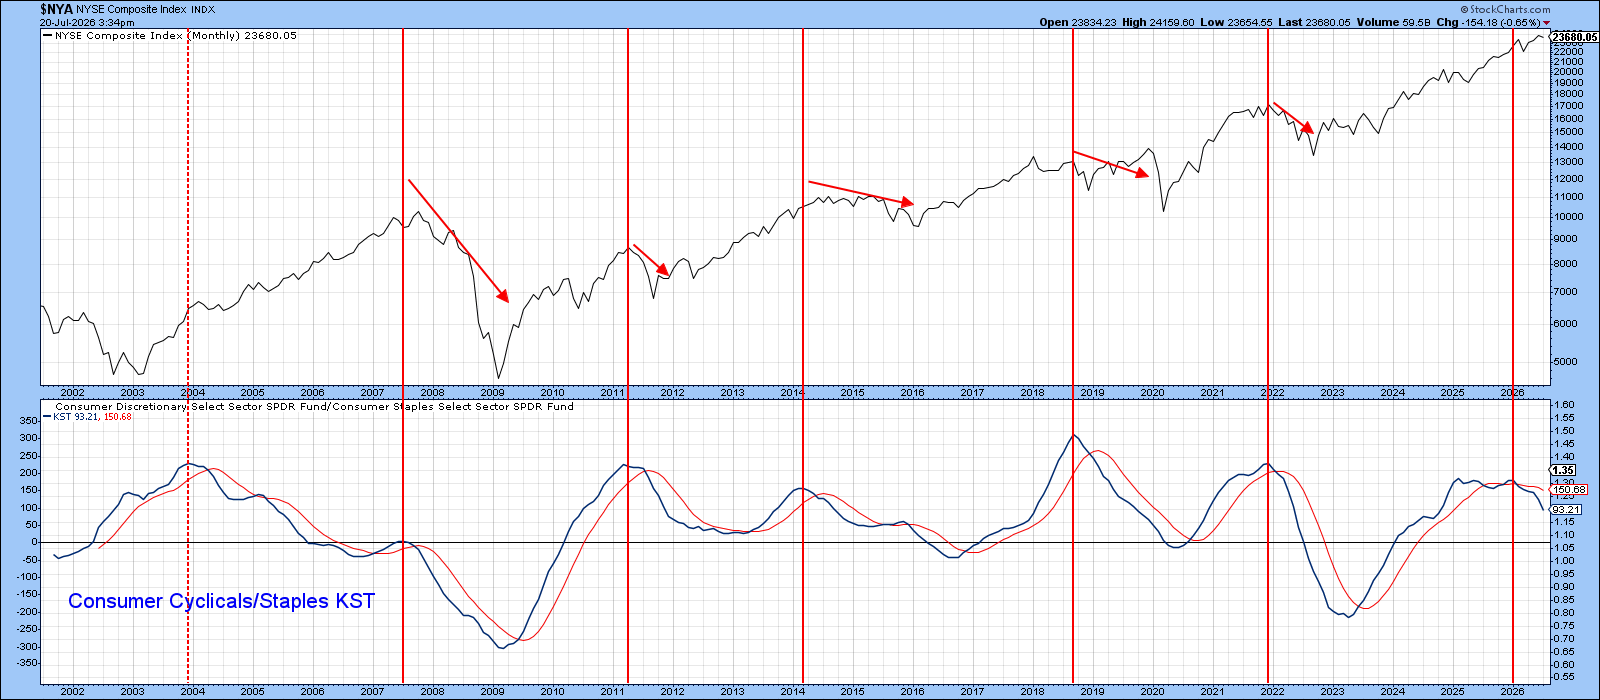
A clearer view comes from pairing the NYSE Composite with the long‑term momentum of the ratio. The KST (Know Sure Thing) indicator marks peaks that often line up with market pull‑backs or higher volatility. The latest KST peak in early 2025 turned down, yet the NYSE kept climbing. This suggests the market still needs consumer confidence to stay strong.
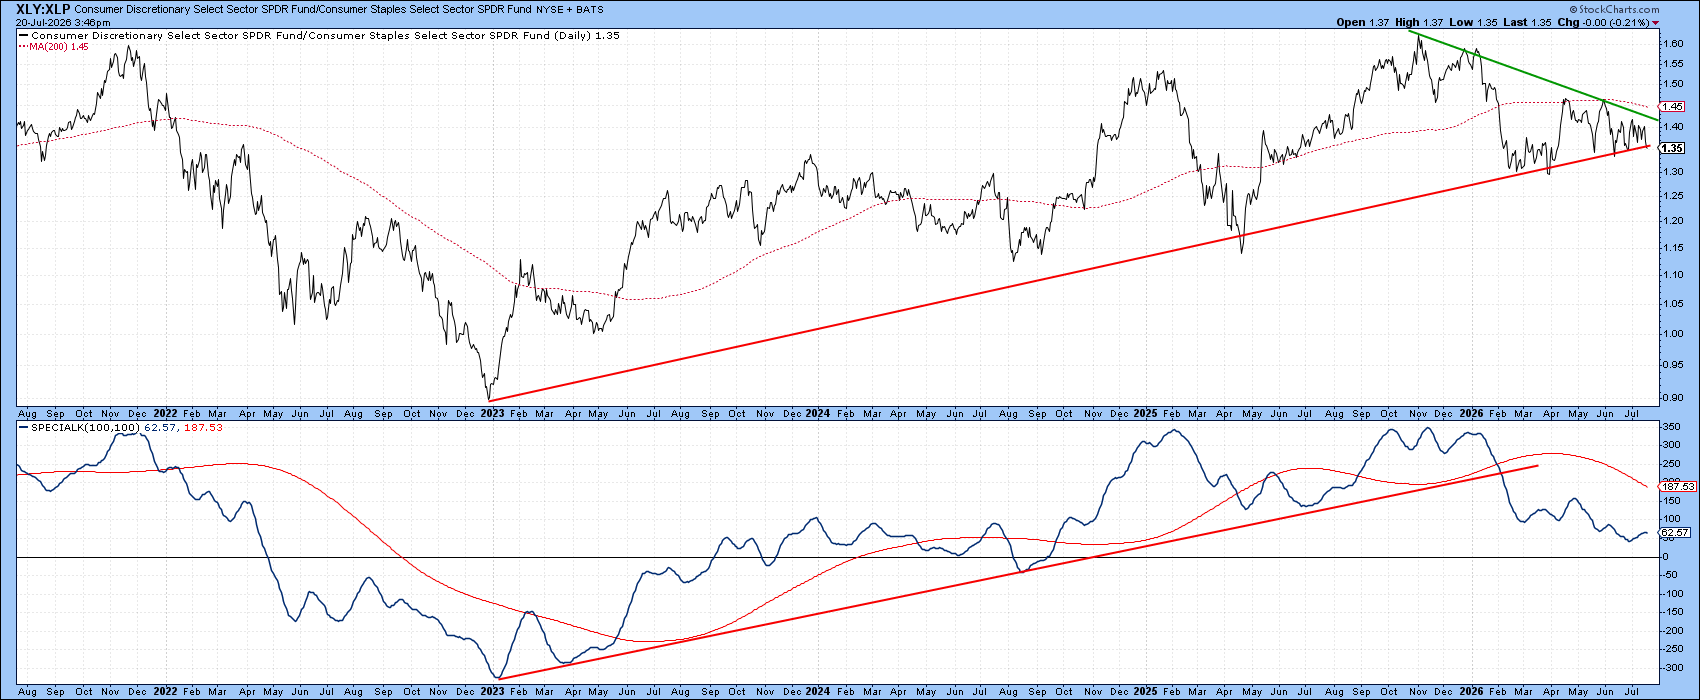
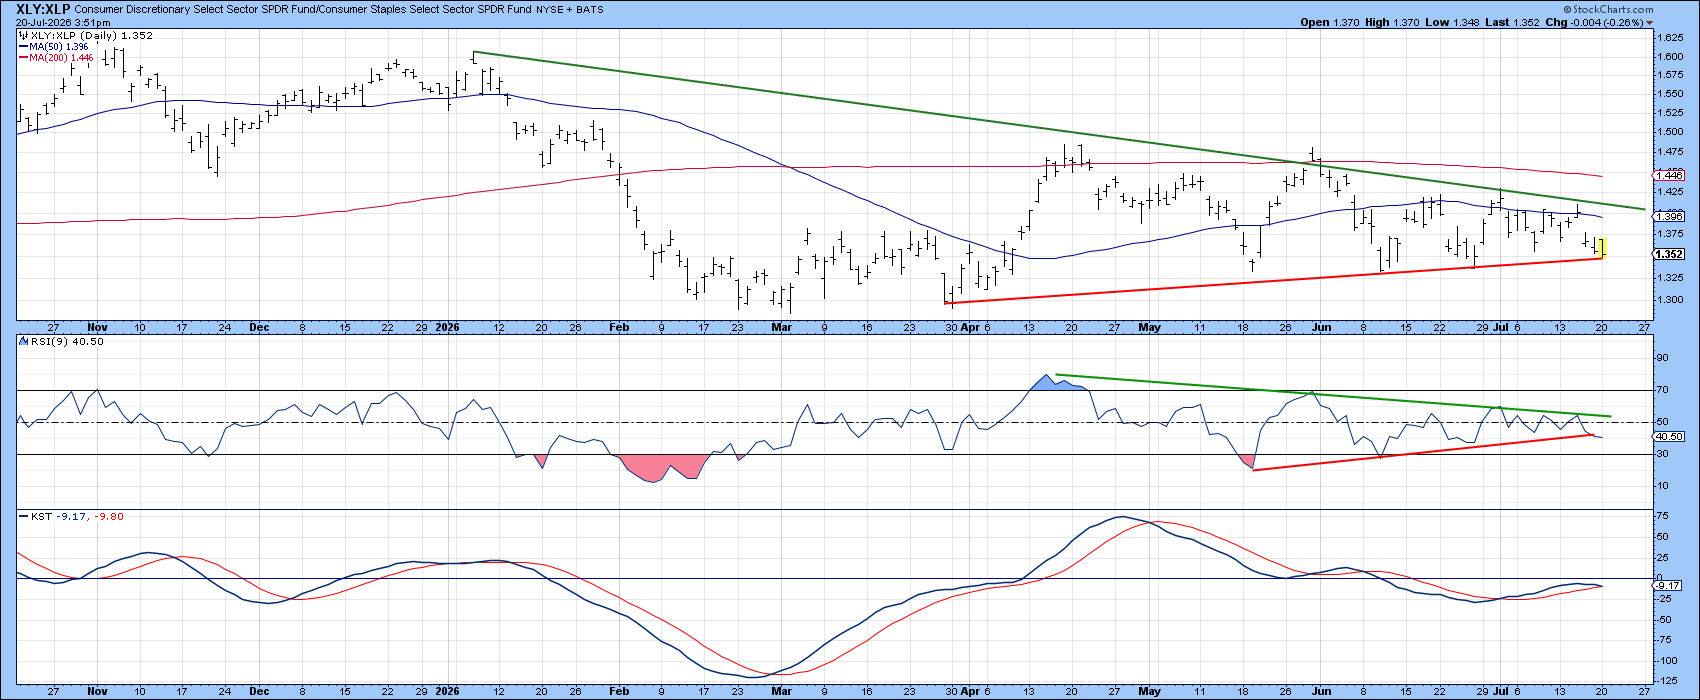
Yes, the ratio is now at a crucial spot. It has fallen below its 200‑day moving average and under the 2023‑2026 uptrend line. If it breaks this trend and stays below, it would be a strong bearish signal.
What the Two Sectors Show Individually
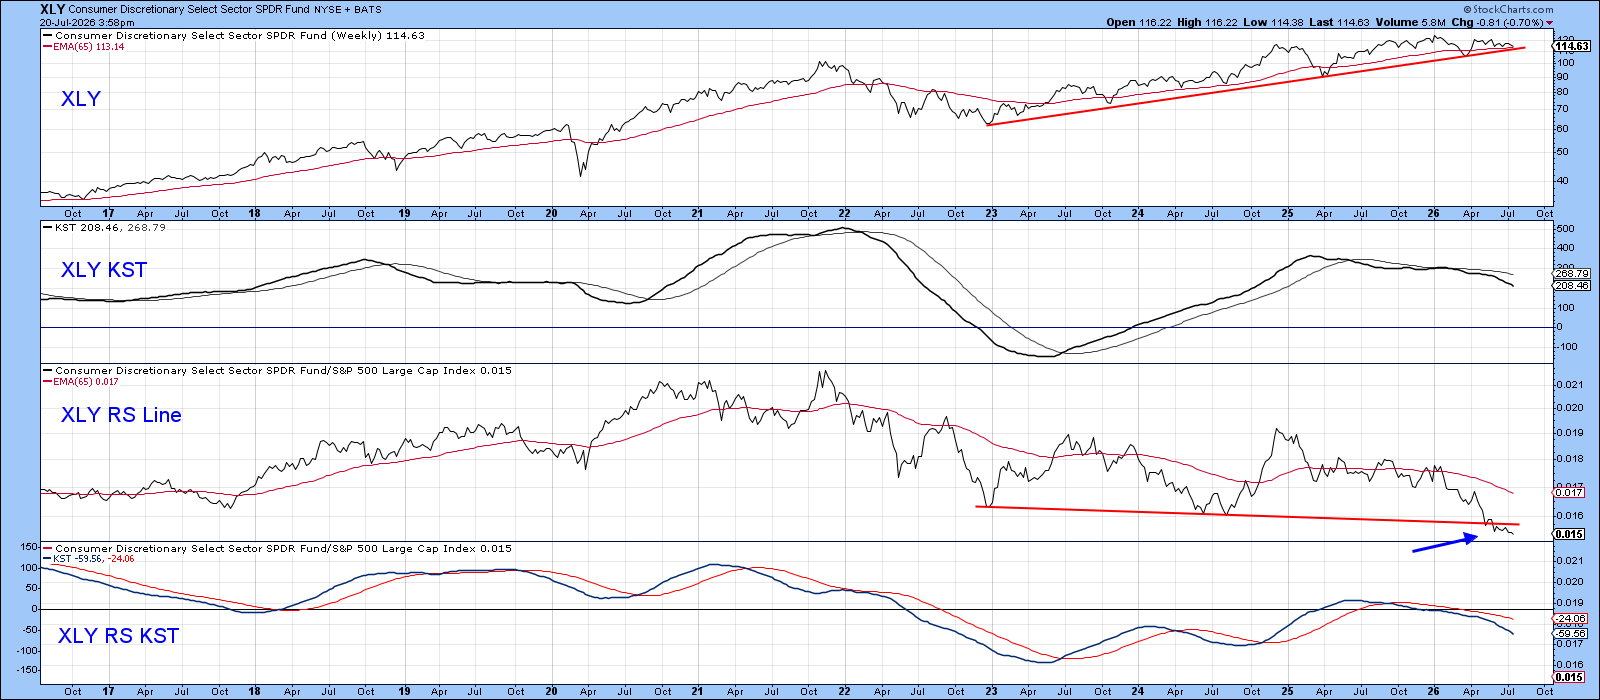
Looking at XLY (discretionary) alone, the price is holding a four‑year support trend and a 65‑week exponential moving average. However, the long‑term KST still points down, and the relative‑strength line has slipped under a key support trend. If this top‑window support breaks, discretionary stocks could fall sharply.
XLP (staples) is also above an important long‑term support line. Its KST readings are positive, indicating some strength, but the relative‑strength line is still under the falling 65‑week EMA. The price has been moving sideways since mid‑2025.
Bottom Line
The XLY/XLP ratio is now sitting on a major long‑term support level. Because this ratio is a popular barometer of consumer confidence and risk appetite, a sustained break below could pull the broader market lower. If the ratio holds and discretionary stocks start to pull ahead again, it would suggest confidence is still strong enough to keep the bull market alive.
Source: Materials provided by https://articles.stockcharts.com.Note: Content may be edited for style and length.