
July was tough for momentum trades, but overall market health kept getting better. Most stocks are still moving up for the long run. New record highs are appearing, and the SPY ETF is resting inside an uptrend. This shows a bull market is still present.
More Stocks Are in Uptrends
The first picture shows how many stocks are trading above their 200‑day simple moving average. It looks at the S&P 500, Nasdaq 100, S&P 400 Mid‑Cap, and S&P 600 Small‑Cap groups. About 70 % of S&P 500 stocks sit above this line, meaning most are in an uptrend and can help keep a bull market alive.

The Nasdaq 100 line rose above 50 % in mid‑April and stayed there, reaching 65.7 % on Thursday. The Nasdaq isn’t as strong as the S&P 500, but the picture still looks half‑filled with bullish signs.
Mid‑cap and small‑cap stocks are leading the way. More than 70 % of S&P 400 and S&P 600 stocks trade above their 200‑day average. Small‑cap stocks even show about 73 % in uptrends, indicating solid strength in that segment.
New Highs Are Growing in the S&P 500
The next chart measures the difference between the percentage of stocks making new highs and those making new lows. A positive number means more stocks are climbing.
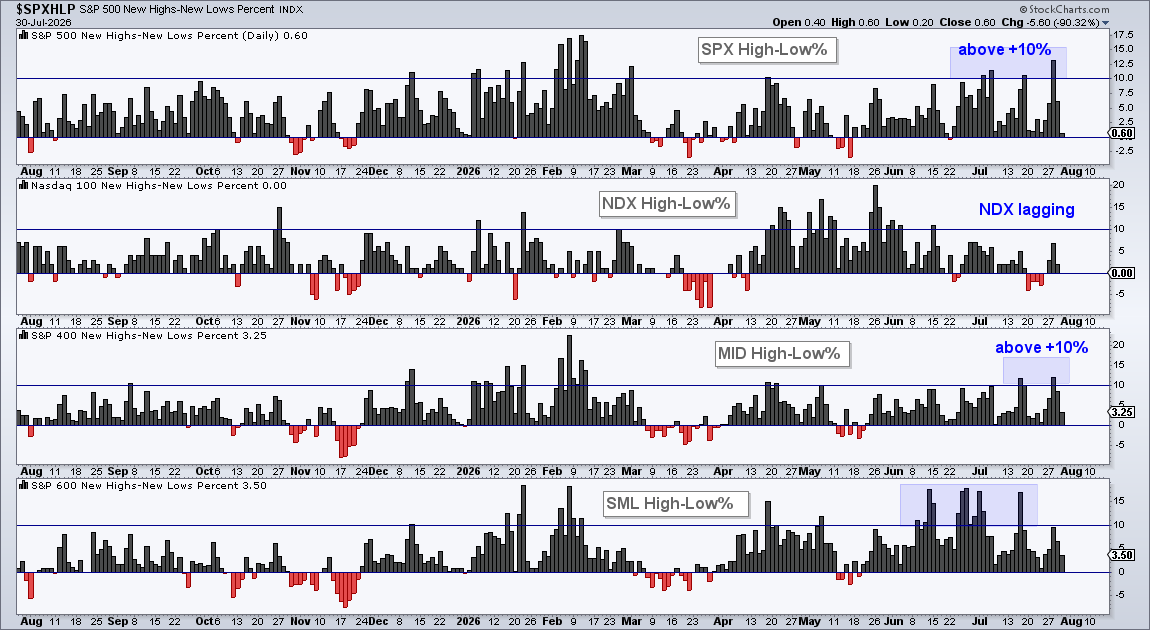
In July the S&P 500 line went above +10 % four times, peaking at +13.2 % – the highest since February. This tells us that many stocks are breaking new records and leading the market higher.
The Nasdaq 100 line stayed below +10 % in July, while the mid‑cap and small‑cap lines both rose above that level, helping lift overall market breadth.
SPY Shows Oversold Signs While It Holds Its Uptrend
The SPDR S&P 500 ETF (SPY) is still in a long‑term uptrend. It made a new high in early June and stays well above its rising 200‑day average.
After a 21 % jump, SPY entered a short pause that lasted about two months. The fast rise was hard to keep up, so the ETF needed time to rest before the next move.
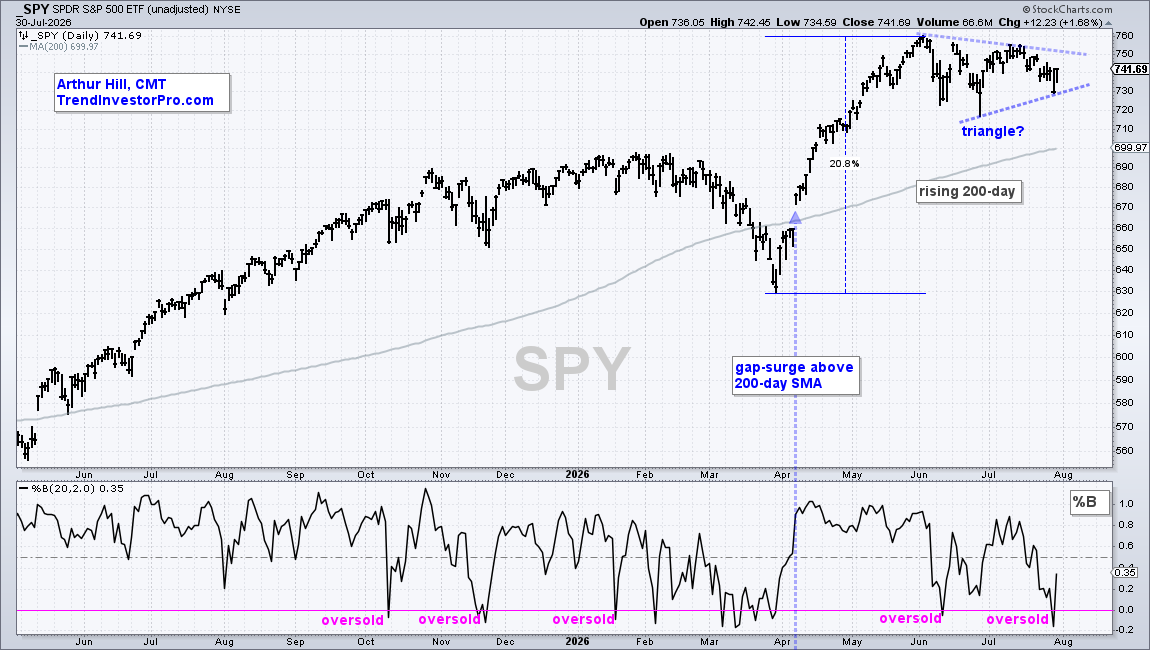
Recent price action suggests SPY may be forming a higher low, which could complete a triangle pattern. If the price breaks out upward, the pause could end and the larger uptrend may resume.
On July 29 the ETF fell below the lower Bollinger Band, a sign that it became short‑term oversold. In an uptrend, such oversold moments often point to a pullback and possible buying opportunities.
Source: Materials provided by https://articles.stockcharts.com.Note: Content may be edited for style and length.