
What a roller‑coaster week! One day the big indexes looked ready to drop, the next day they bounced back and finished higher.
Weekly highlights:
- Big swings in the market
- Finding strong‑looking stocks
- Improving your scan skills
If you trade for a few days, the past week probably tested your patience. Earnings from four major companies caused sharp moves. Chip stocks fell, then recovered. The Federal Reserve met, inflation numbers came out, and the yen was intervened.
Even long‑term investors felt uneasy. By Friday, however, the S&P 500, Nasdaq Composite and Dow Industrials all closed the week with gains.
News, data and surprise headlines always move the market. Instead of reacting to every headline, look for stocks that fit your own rules.
Using a screener to narrow the list
After the big‑cap earnings reports, I opened the free StockCharts Screener to look for S&P 500 companies with solid fundamentals.
First, I chose the "S&P 500" group. Then, under the Fundamentals tab, I set three filters:
- Year‑over‑year earnings per share growth > 0
- Year‑over‑year revenue growth > 0
- Price‑to‑earnings ratio between 20 and 50
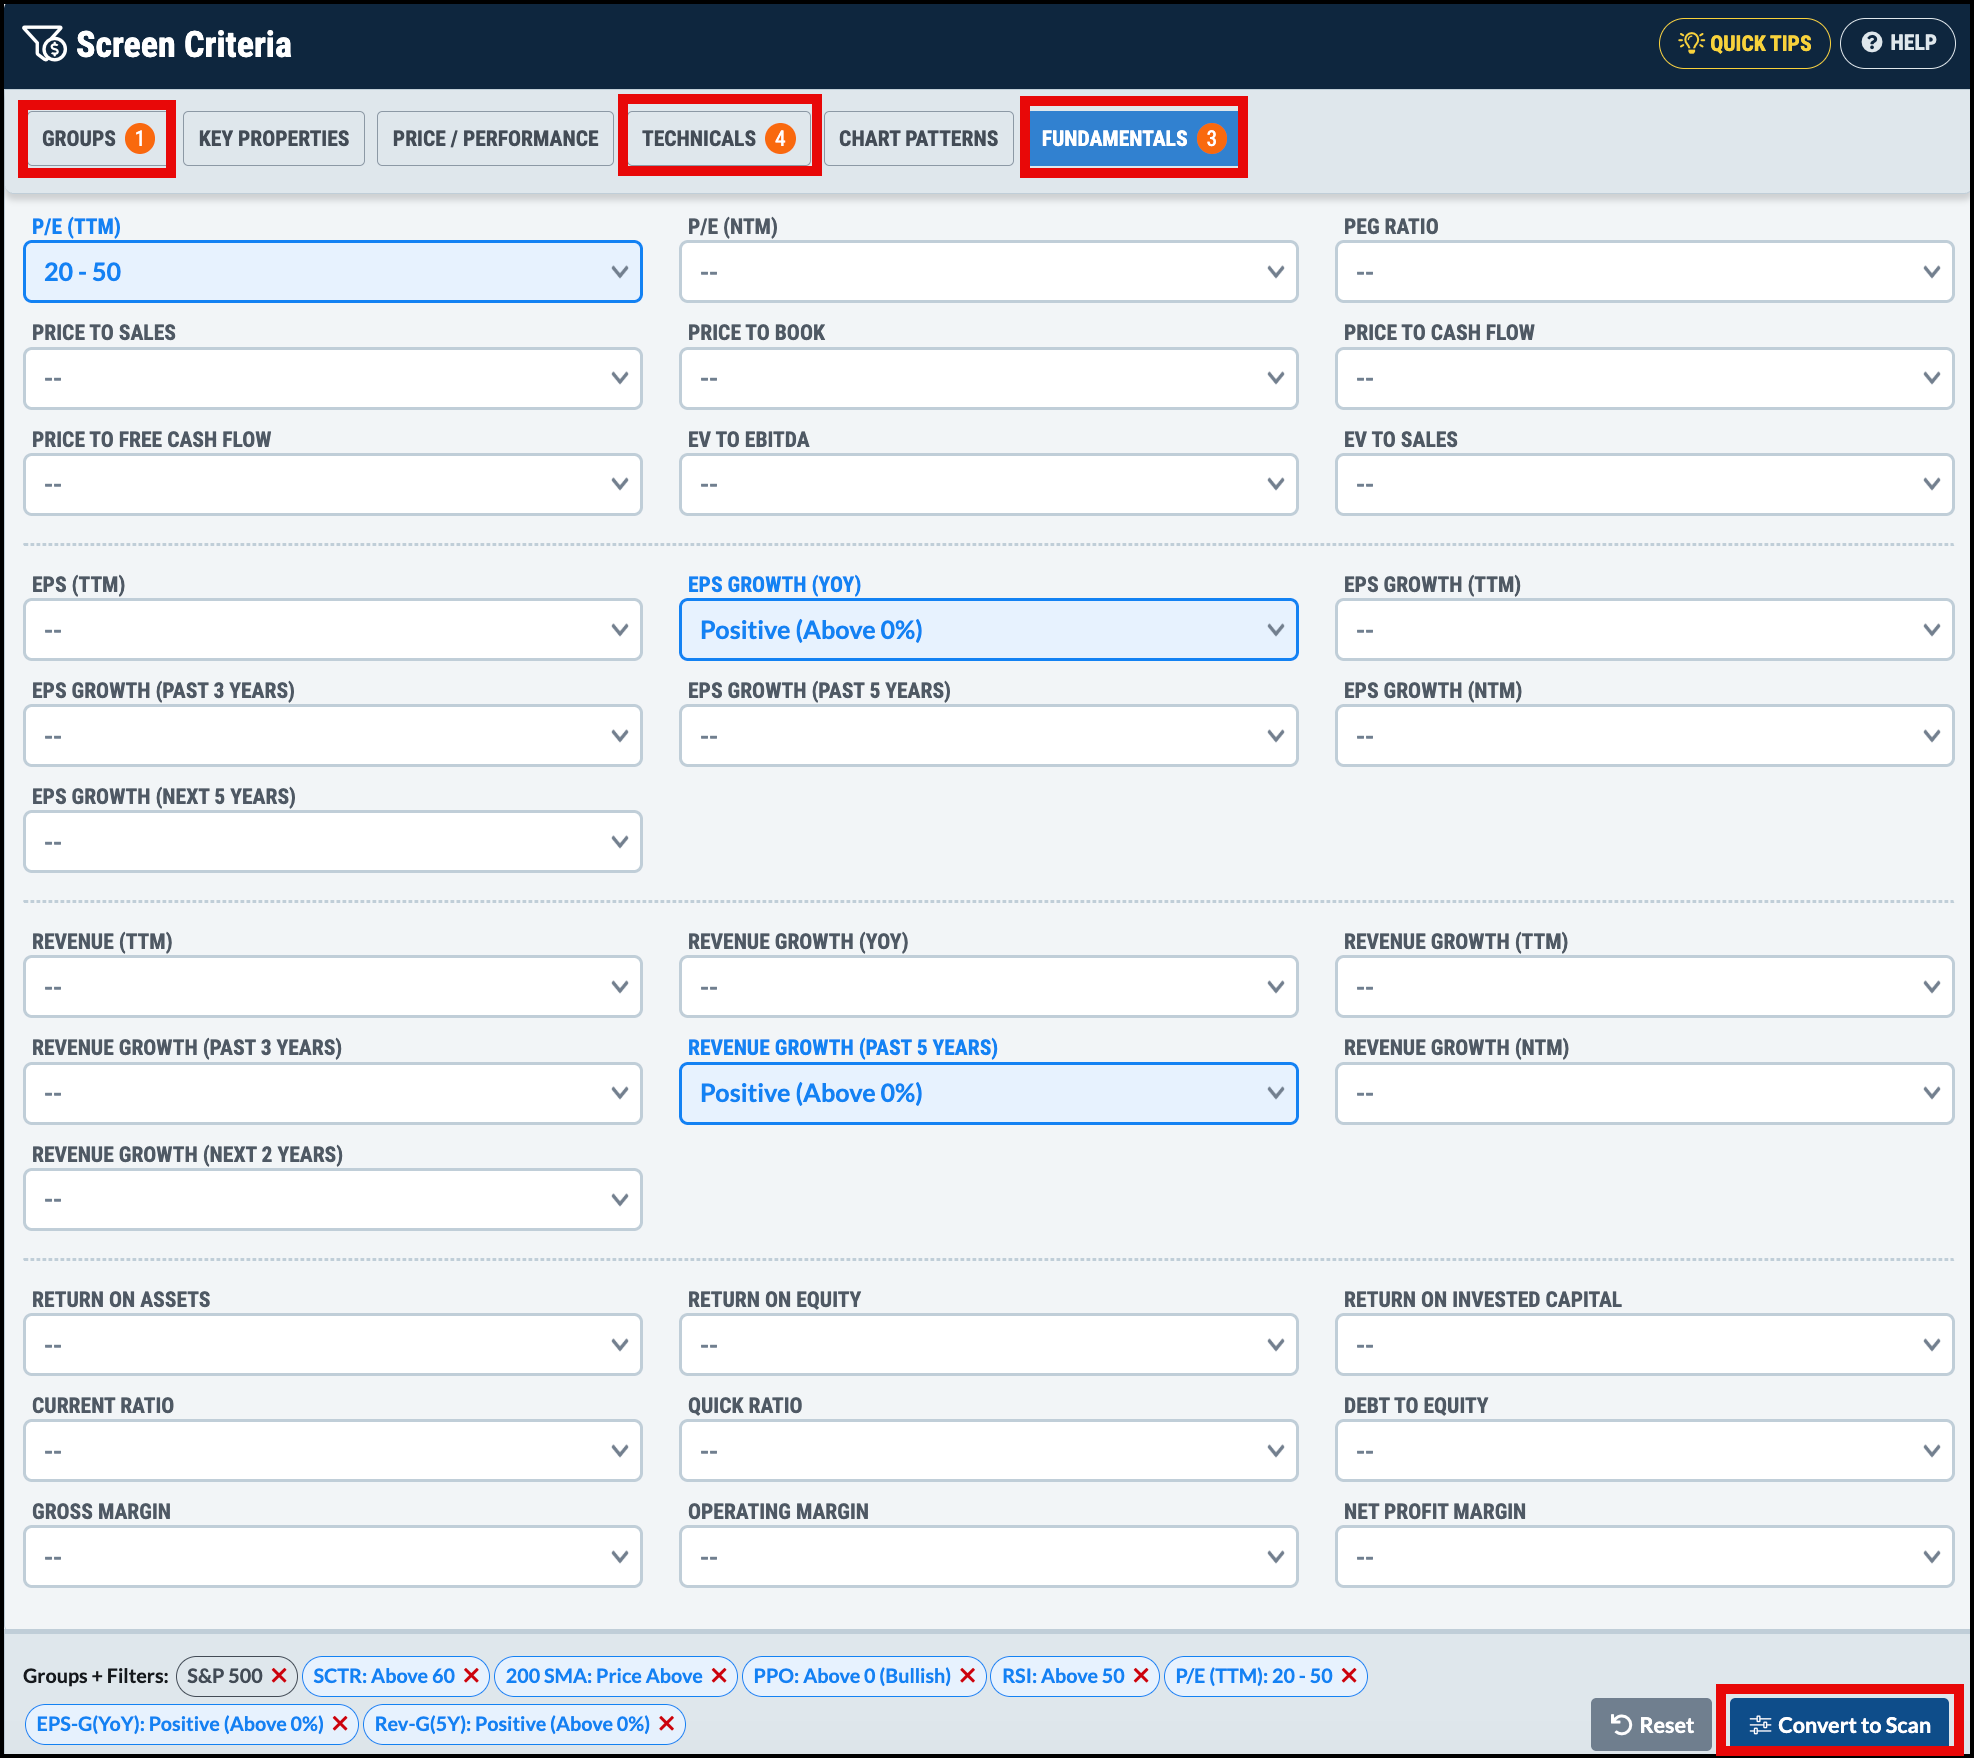
Good fundamentals are a solid start, but they don’t tell the whole story. I also wanted stocks that were already moving up and showing strength.
To do that, I added four technical filters:
- Price above the 50‑day simple moving average
- Percentage Price Oscillator (PPO) greater than zero
- Relative Strength Index (RSI) above 50
- StockCharts Technical Rank (SCTR) higher than 60
The screener trimmed thousands of symbols down to fewer than 50. That is a short list you can review each day.
Take the scan a step further
If you like, you can add more detail. For example, you might want an RSI between 50 and 70. Click the "Convert to Scan" button and then add these two lines:
    and [Daily RSI(14,Daily Close) > 50]
    and [Daily RSI(14,Daily Close) < 70]
Pro tip: Before you run the scan, hit the "Reformat" and "Check Syntax" buttons. They will catch any mistakes early.
When the scan looks good, save it. You can run it anytime, or keep tweaking the conditions until it fits your style.
The StockCharts Screener lets you research, filter, and view charts all in one place. No need to jump between different websites.
Think about what matters most to you in a stock. Put those ideas into the screener, look at the charts, and you may find your next good investment.
Have a great weekend!
Source: Materials provided by https://articles.stockcharts.com.Note: Content may be edited for style and length.