
Before We Start…
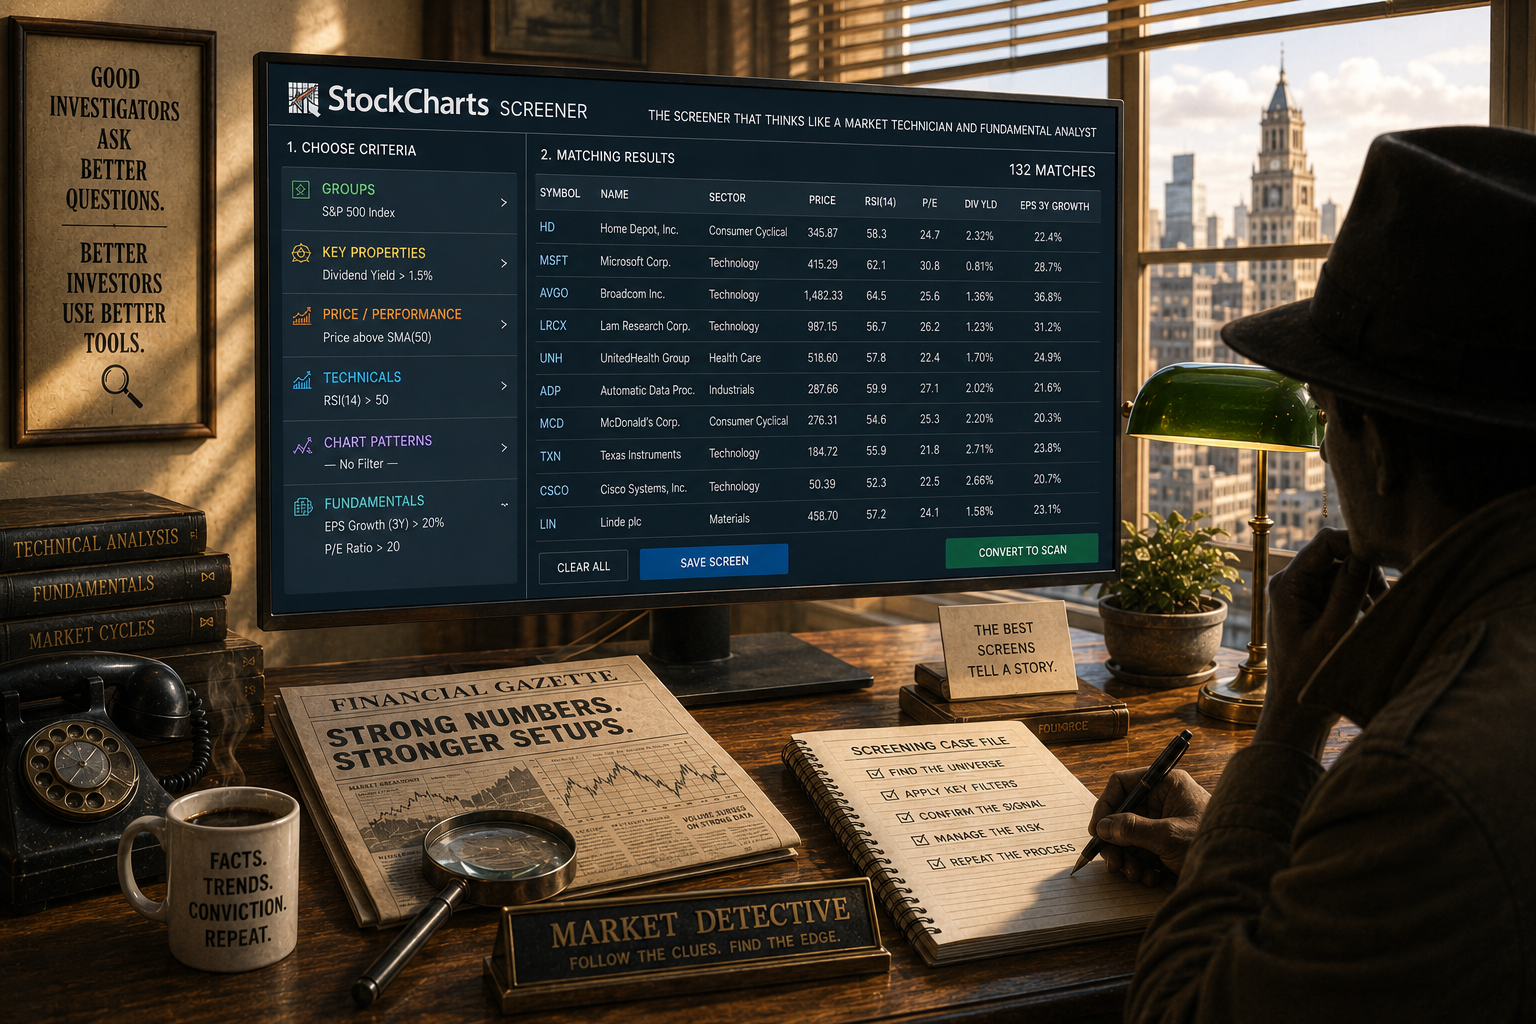
Sometimes you just want a quick list of stocks or ETFs that fit a simple idea. You may need a few technical signs and a few fundamental facts. You don’t want to write code or build a complex scan right away. You just want fast results. In short, you need a strong screener.
Most screeners look at only fundamentals or only technicals. The StockCharts Screener does both at the same time.
An Industry‑Leading Screen Engine
Imagine you want to see both price moves and business health before you pick a stock. A stock might look good on a chart but have weak earnings. Or it might have great earnings but be stuck in a price dead‑zone. The best picks usually have strength in both areas.
That is why the new screener lets you mix and match many filters. You can test any idea you have.

Here is what each group of filters means:
- Groups: Choose an index, sector, industry, exchange, and other broad categories.
- Key Properties: Market cap, dividend growth, float, beta, institutional ownership, and similar data.
- Price / Performance: Simple price moves, highs, lows, and basic technical facts.
- Technicals: RSI, moving averages, and other common indicators.
- Chart Patterns: Classic patterns and candlestick formations.
- Fundamentals: Ratios such as P/E, PEG, price‑to‑book, price‑to‑sales, and more.
Mix filters from any of these six groups. The results change instantly, so you can see if a filter is too strict or too loose.
Try building a simple screen now. Come back for insider tips when you’re ready.
Insider Tip #1: Keep the Screener Light
The screener can handle many filters, but adding too many makes it act like a scan. When results become vague, click Convert to Scan. This moves the logic to a more powerful engine built for complex work.
Insider Tip #2: Use Both Technicals and Fundamentals
Instead of choosing one side, try a combo. For example, look for stocks with RSI above 50 and price above the 50‑day average **and** earnings growth that is positive with a reasonable PEG. A stock that meets both sets of rules is liked by both traders and analysts.
Insider Tip #3: Experiment With Combinations
There are six groups and 99 individual filters. Using all of them creates over a billion possible screens. You won’t need that many, but you can create millions of different mixes. Test different ideas: oversold blue‑chip stocks, small‑cap breakouts, sector rotation plays, dividend stocks with strong charts, and so on.
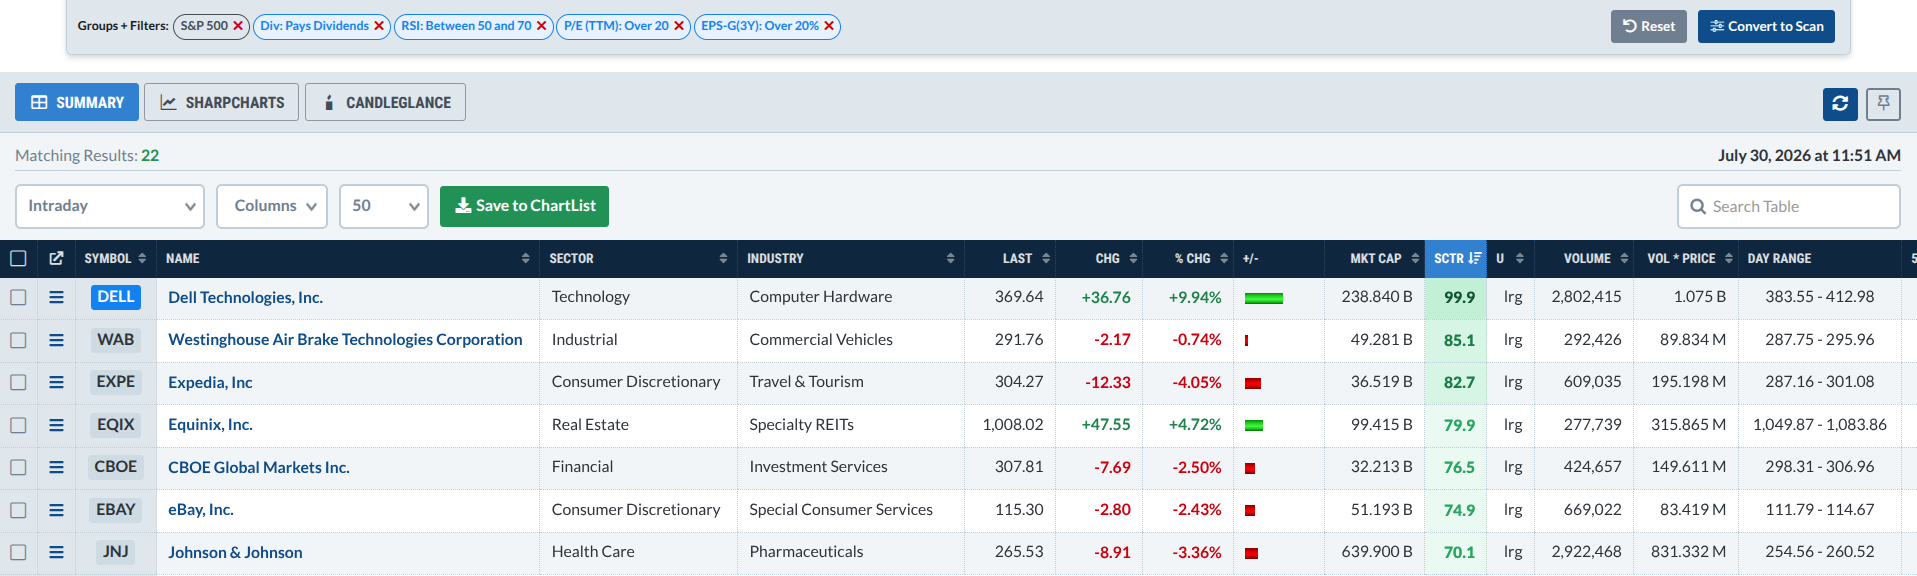
For example, a screen for S&P 500 dividend stocks with RSI in a bullish range, P/E above 20, and EPS growth over 20 % in the last three years works well.
The key is not to use the same screen over and over. Every new trading idea needs a fresh mix of filters.
And That’s It
The StockCharts Screener lets you test market ideas fast. When the market changes, you can tweak filters to match new sentiment, fundamentals, or technical patterns. Start simple, play with different combos, and move to a full scan if the screener feels too limited. Most of all, spend some time getting comfortable with it.
Source: Materials provided by https://articles.stockcharts.com.Note: Content may be edited for style and length.