

The S&P 500 has been moving sideways for a while. Even though the big index looks flat, many long‑term breadth tools still look healthy. Does this mean the market is still in a strong bull phase?
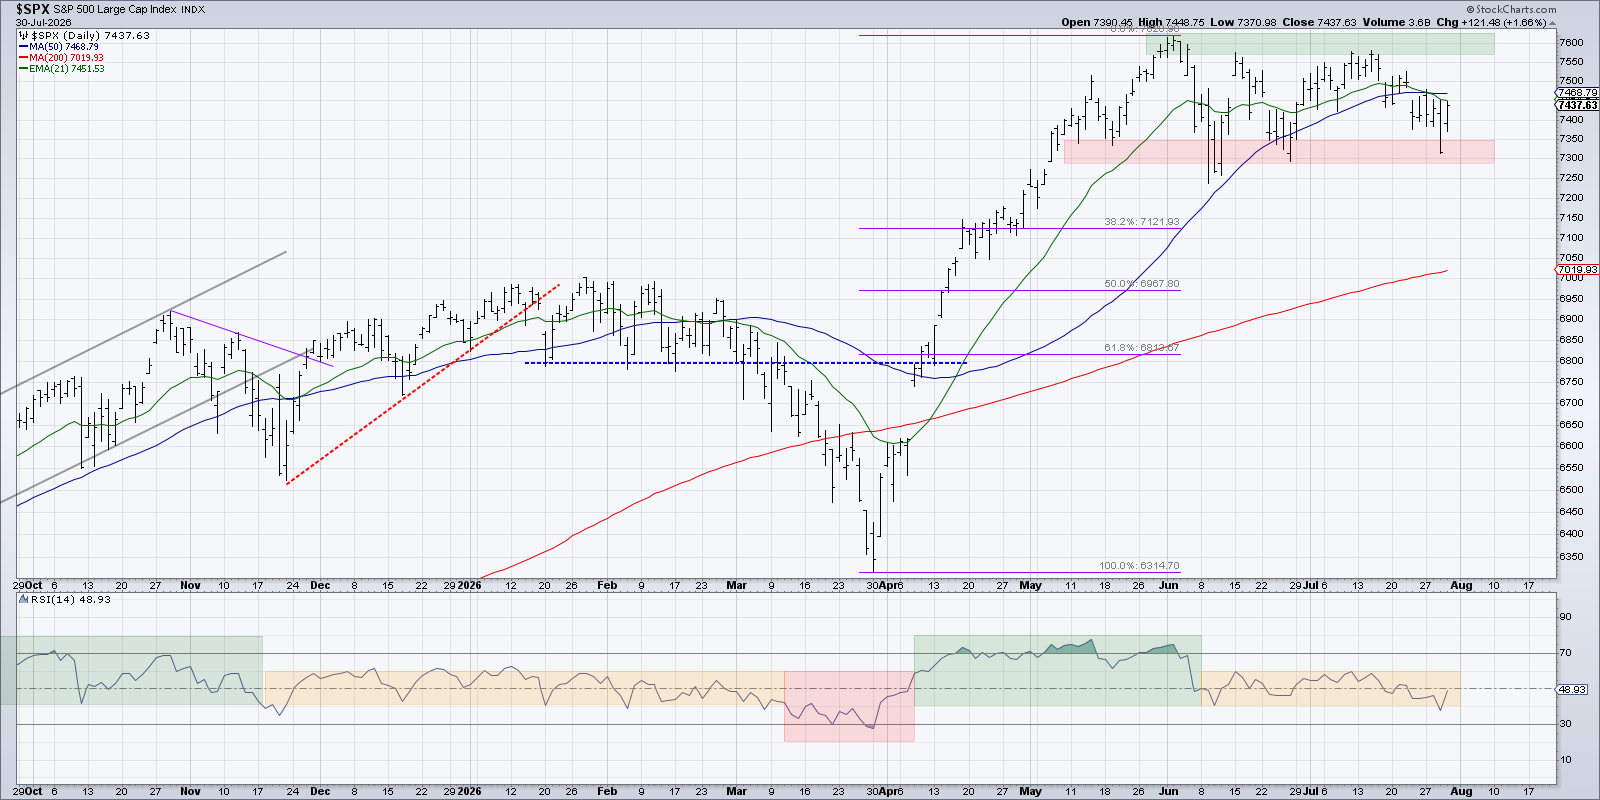
The index is testing the 7,300 level again. Most S&P 500 stocks are still above their 50‑day moving averages, which usually shows an uptrend. But a few weak spots keep the whole market from moving higher.
Moving‑Average Breadth Shows a Primary Uptrend
About 64% of the S&P 500 stocks sit above their 50‑day moving average, and roughly 69% are above the 200‑day line. These numbers suggest many stocks are still in an uptrend, even if the index looks flat.
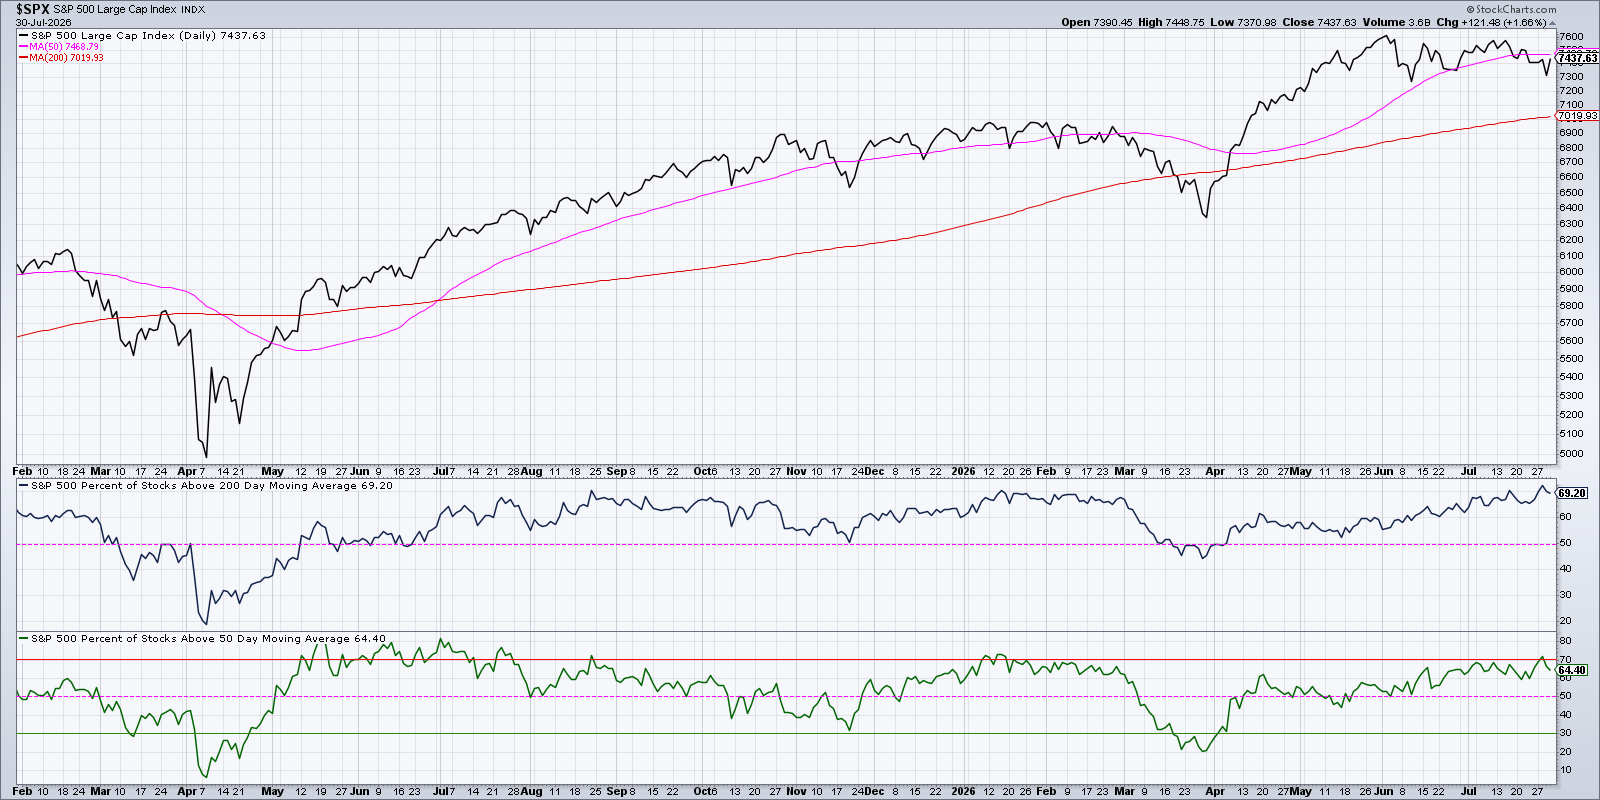
The sideways action seems to come from big‑tech weakness rather than a broad market problem.
Three Breadth Tools Giving a Cautious View
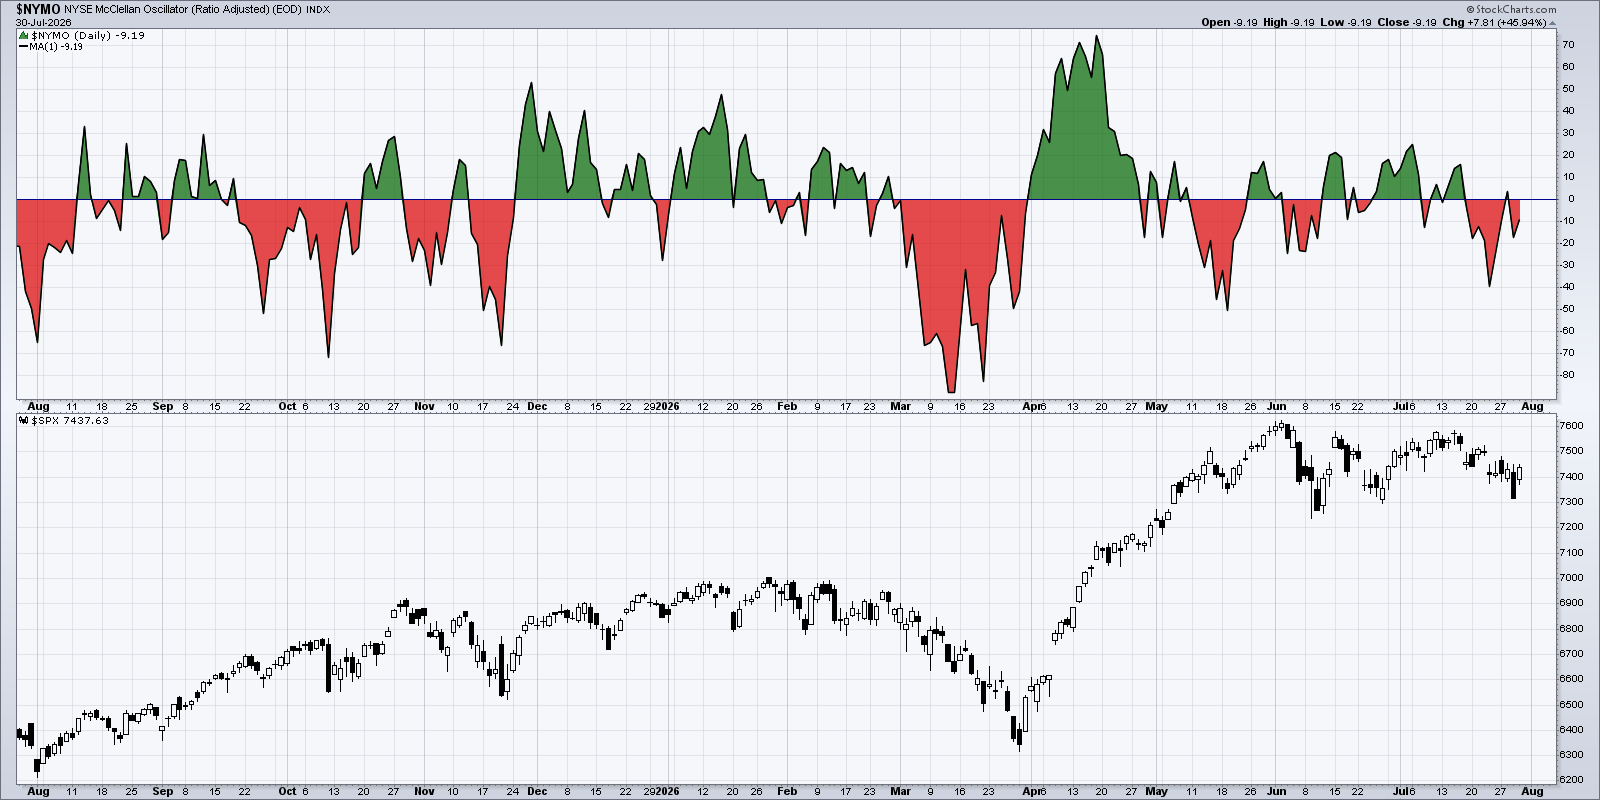
The McClellan Oscillator, a short‑term breadth measure, has been below zero for a couple of weeks. Even though the advance‑decline line made new highs, a negative oscillator means the advance is slowing.
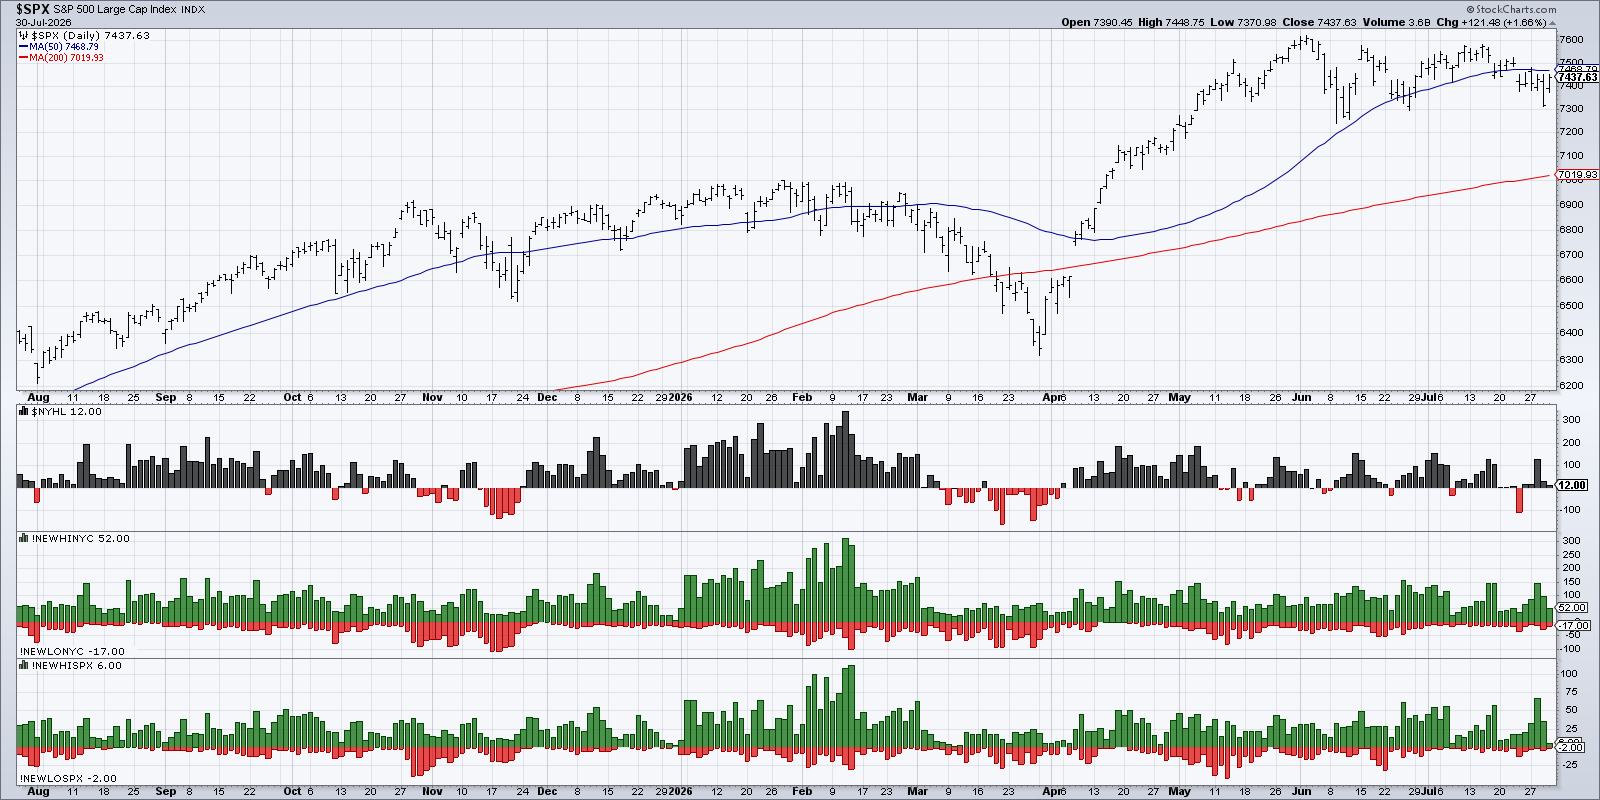
Healthy bull markets also show many new 52‑week highs. In the past week, only a small portion of S&P 500 stocks hit that mark, though Tuesday saw a brief spike to about 13.5%.
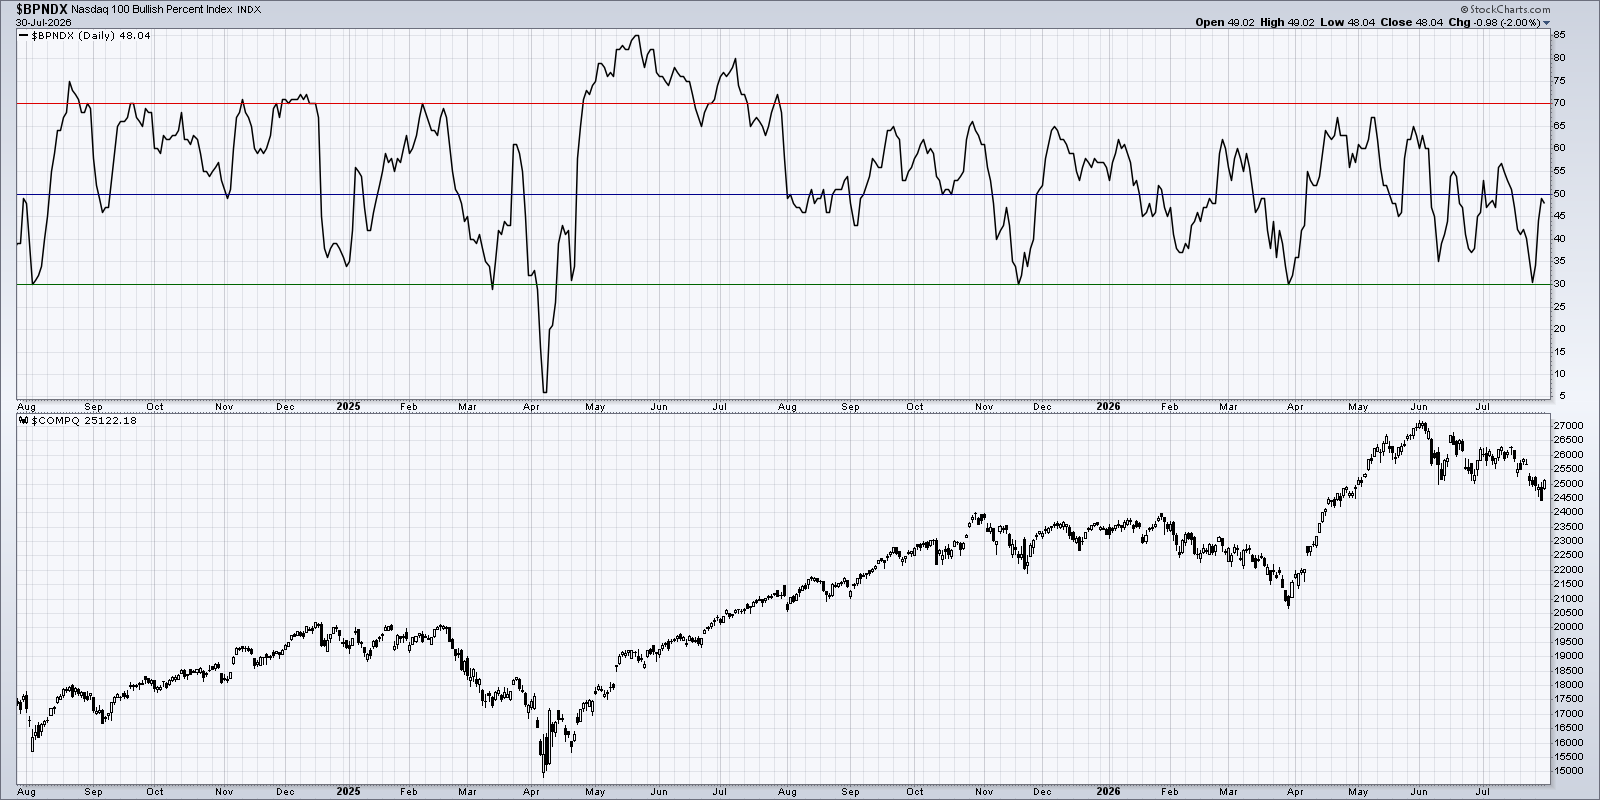
The Nasdaq‑100 Bullish Percent Index fell to 30% last Friday. Historically, when this index climbs back above 30%, the Nasdaq Composite often bounces higher.
What to Watch for a Bullish Turn in Q3
To see a stronger market, we need three things:
- Moving‑average breadth staying above 50%.
- McClellan Oscillator moving back above zero.
- More stocks reaching new 52‑week highs.
Most importantly, the Nasdaq‑100 Bullish Percent Index should rise again, showing that large‑cap growth stocks are regaining strength.
When these signs line up, stock pickers may find better opportunities, and the big indexes could break out of their current range.
Source: Materials provided by https://articles.stockcharts.com.Note: Content may be edited for style and length.