
People are talking a lot about using AI to choose stocks. It feels similar to the hype around neural‑networks in the 1990s. Back then, pricey software promised big returns, and sometimes it worked—until the market changed.
Today, social media is full of claims that AI can find the next market leader or give you profitable trades on demand. But should you trust a machine to pick winners?
What AI Can and Can't Do
AI is good at gathering data, summarizing news, and spotting patterns. It can turn long earnings reports into short bullet points, saving you time.
However, the real work starts after the summary. You still have to decide how the information fits your own plan. AI that simply repeats past patterns may give biased advice when market conditions shift.
Another risk is data quality. If the AI uses outdated or wrong numbers, the suggestions will be off. Bad data can lead to entering a trade too early, sizing a position wrong, or trading too often.
AI also depends on the prompts you give it. Many online posts promise "perfect prompts" for finding winning trades, but most are click‑bait or even scams.
A Better Way to Research Stocks
Instead of relying on AI summaries, use a tool that shows you the raw market data in clear charts. This lets you set your own rules, see why a stock appears, and avoid hidden biases.
StockCharts provides exactly that. It gathers large amounts of market data, displays it visually, and lets you build custom scans. You decide what matters, create filters, and review each chart before making a move.
The Market Summary page gives a quick view of major indexes, sectors, bonds, and commodities. From there you can tell if the overall market is still climbing, pulling back, or about to turn.
Once you know the market mood, the Scan Engine helps you find stocks that match your criteria.
Simple Step‑by‑Step Stock Picking
Start on the Equities tab of the Market Summary. If the big U.S. indexes are trending up, you might want to trade with that direction.
Long‑Term Trend Scan
For a trend‑following approach, look for S&P 500 stocks where the short‑term weekly moving average is above the longer‑term weekly moving average.
[group is SP500]
AND [SMA(22, Weekly Close) > SMA(55, Weekly Close)]
If the market is bullish, this scan returns many stocks. Narrow the list by adding a sector filter. For example, to focus on financials:
AND [group is FinancialSector]
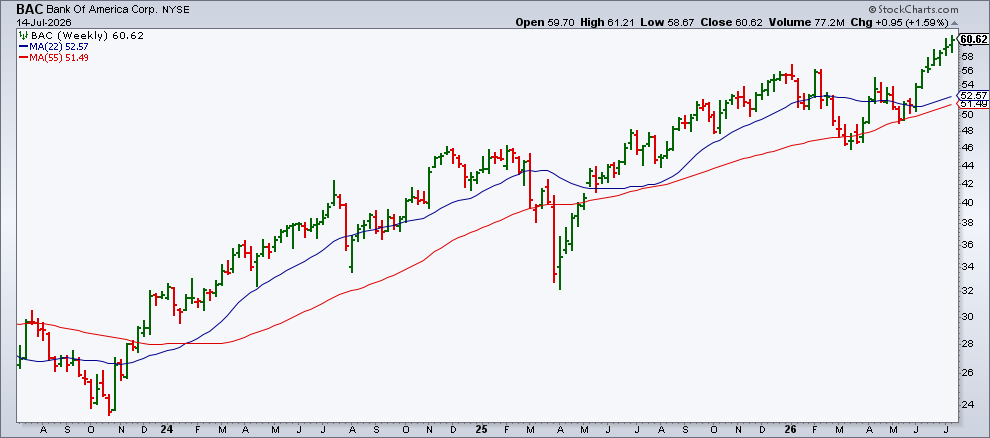
One result might be Bank of America (BAC). Its weekly chart shows a clear uptrend.
Swing‑Trade Scan
Even in a rising market, stocks pull back. A pullback near a key support level can be a buying chance.
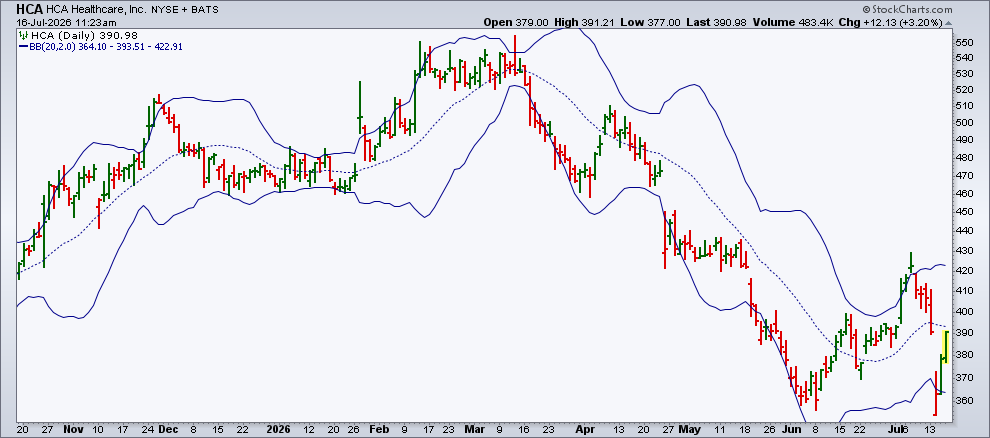
Look for stocks that fell below the lower Bollinger Band, which can signal oversold conditions.
[group is SP500] OR [group is SP400] OR [group is SP600] OR [group is NASDAQ100]
AND [Yesterday’s Close >= Yesterday’s Lower BB(20,2)]
AND [Today's Close = Today's Lower BB(20,2)]
When a stock drops below the band, check its volume and momentum before entering.
On July 14, 2026, HCA Healthcare (HCA) hit the lower band and then bounced back toward its 20‑day average.
Short‑Term Momentum Scan
For traders who like quick moves, filter for stocks above the 200‑day moving average, with volume higher than the 50‑day average, and an RSI above 50.
[group is SP500]
AND [close > SMA(200, close)]
AND [daily volume > SMA(50, daily volume)]
AND [RSI(14) > 50]
Run the scan, review the charts, and save the winners to a list for later action.
Final Thoughts
Building a scan is like planning a kitchen: many parts, but the final result depends on how they fit together.
StockCharts gives you transparent data, visual tools, and the freedom to set your own rules. It narrows the field so you can focus on the charts that matter. The final call—what to buy, how much, and when to exit—always stays with you.
Disclaimer: This article is for educational purposes only and does not constitute financial advice. Consult a professional before making any investment decisions.
Source: Materials provided by https://articles.stockcharts.com.Note: Content may be edited for style and length.