

We see the S&P 500 moving sideways, making a flat pattern called a basing pattern. As long as the price stays inside this range, the market will stay calm.
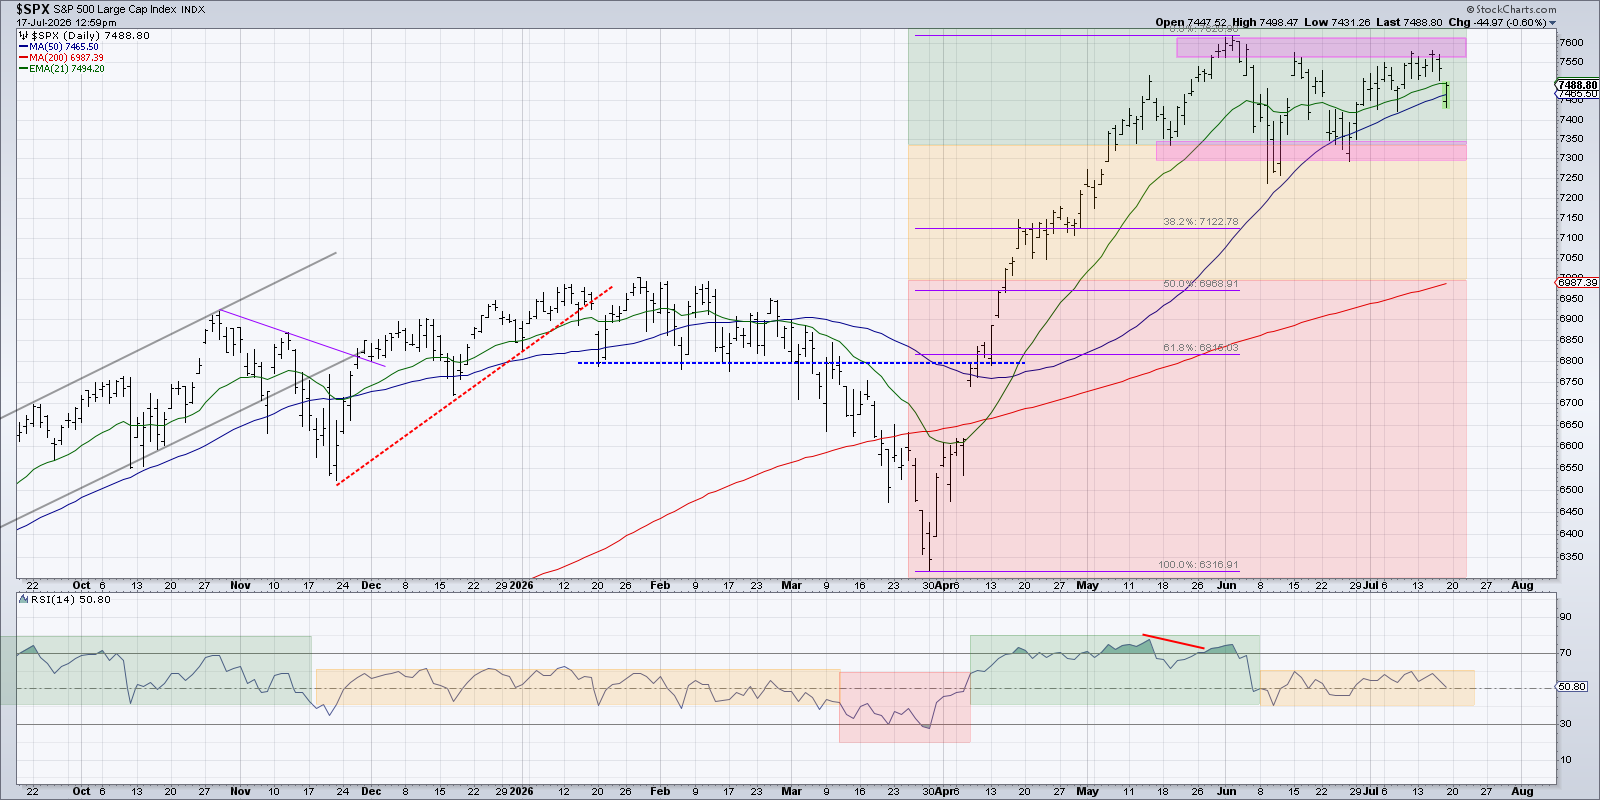
Even if we call this a basing pattern, it helps to think about other possible routes the market could take.
Let’s try a "choose your own adventure" game for the S&P 500. By looking at four different outcomes now, we can be ready for whatever happens later.
Earlier in June we did the same thing for the Nasdaq 100 ETF. The real market ended up right between two of the four paths we imagined.
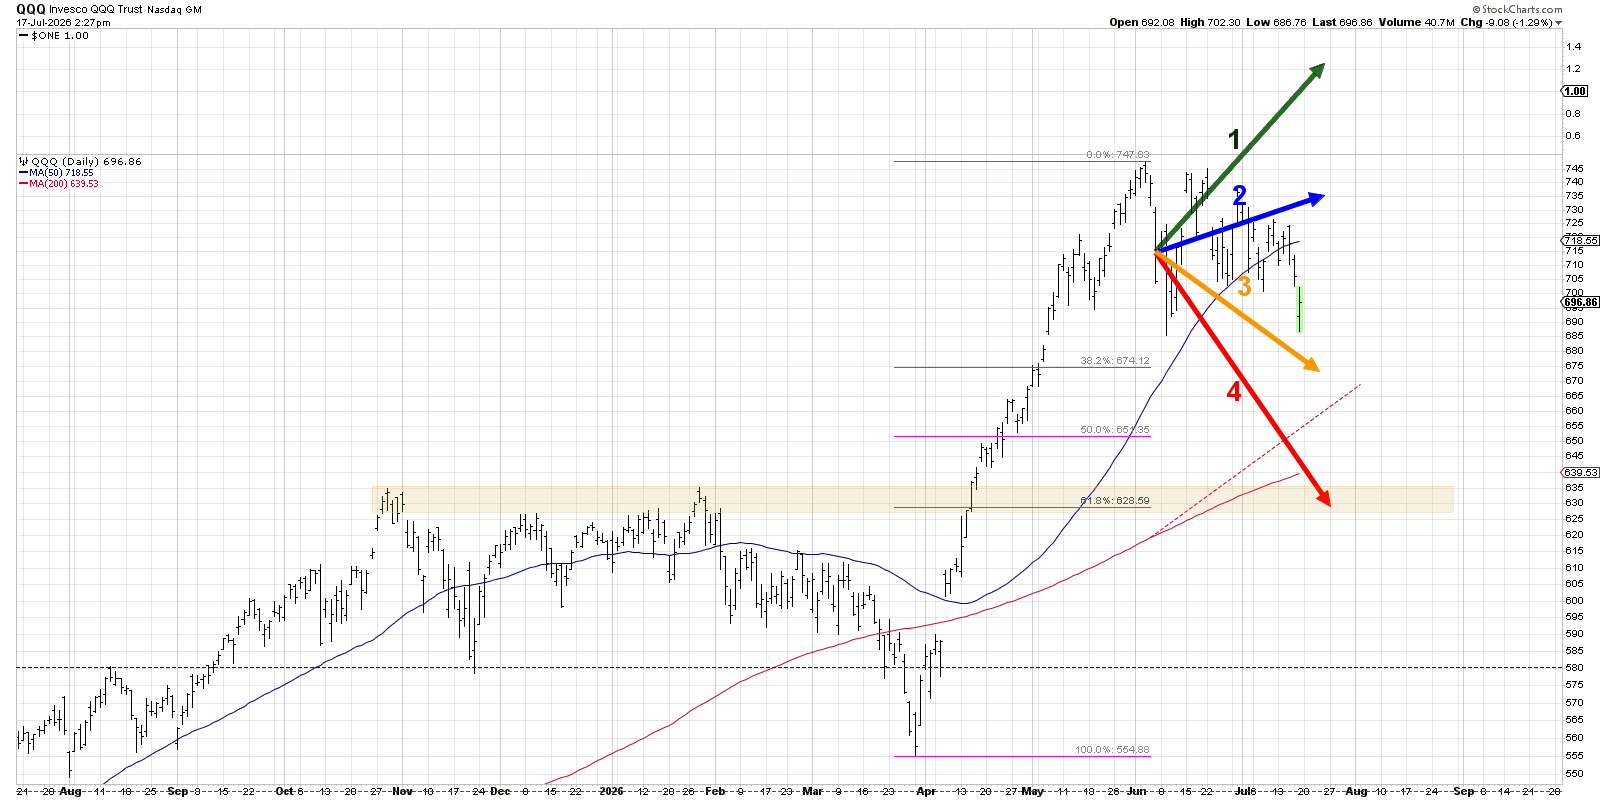
At that time, the QQQ was near the mildly bullish path, but weak chip stocks pushed it into the middle of two scenarios. The market was basically moving sideways.
Now let’s look at four scenarios for the S&P 500 from now until the end of August 2026. This exercise has three goals:
- Think about what could cause each path, and what signals would confirm it.
- Pick the scenario you think is most likely and explain why.
- Consider how each path would affect your portfolio and what risk‑management steps you might take.
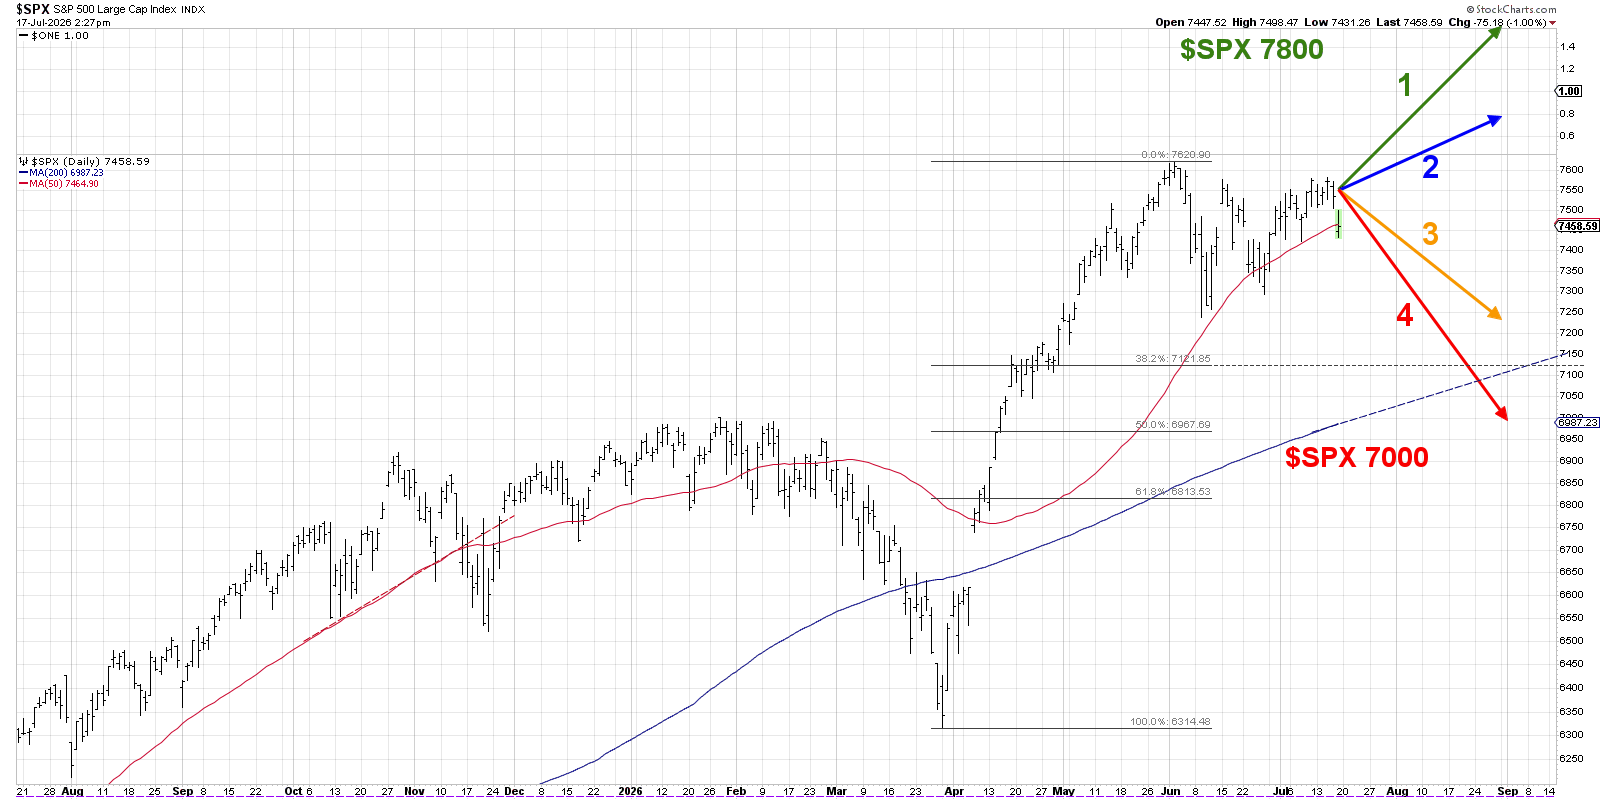
Scenario 1: Super Bullish
If chip stocks bounce quickly and growth companies regain momentum, buying could surge again. Strong AI excitement and lower‑than‑expected inflation could keep the Federal Reserve from raising rates soon.
In this case, the S&P 500 might climb toward 8,000 by September.
Probability: 5%
Scenario 2: Mildly Bullish
Suppose chip stocks stay weak, but other areas like finance and industry stay solid. The index could drift higher with low volatility, and the VIX would stay under 20.
Value sectors would lead, while technology would lag.
Probability: 25%
Scenario 3: Mildly Bearish
If the market stays in a tight range for the next six weeks, the S&P 500 might slip back to around 7,300. Poor earnings and a broader decline in AI stocks could hurt confidence.
Rising oil prices and geopolitical tension could add inflation worries, prompting investors to become defensive.
Probability: 60%
Scenario 4: Super Bearish
In a worst‑case view, the index could break below its 200‑day moving average, triggering a risk‑off wave. The VIX would rise above 20, credit spreads would widen, and a full distribution phase would start.
Defensive sectors might hold better, but could still fall. By late August, the market could test the March low near 6,300.
Probability: 10%
Which Path Do You Prefer?
To sum up:
- Scenario 1 – A strong rebound from March lows.
- Scenario 2 – A gentle rise as growth slows.
- Scenario 3 – A moderate pullback toward defensive stocks.
- Scenario 4 – A deeper decline starting a new distribution phase.
The goal isn’t to be right, but to be prepared. By thinking about many outcomes now, we are less likely to be surprised later. Spotting the right signals will let us adjust our positions in time.
Source: Materials provided by https://articles.stockcharts.com.Note: Content may be edited for style and length.