
Technology Sector at a Crossroads
This week all eyes are on the technology sector.
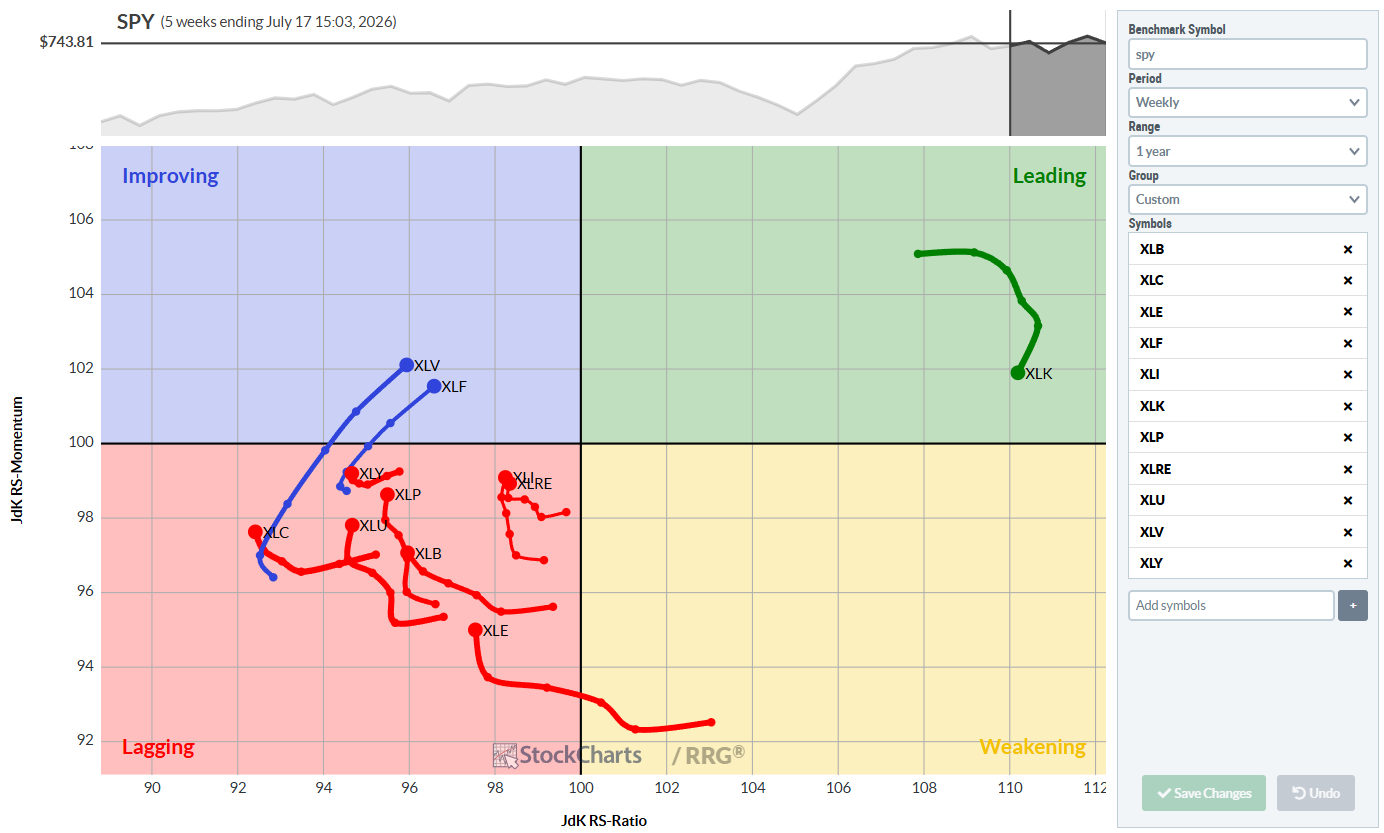
The weekly Relative Rotation Graph (RRG) shows a strange picture. Technology is the only sector still moving up compared to the S&P 500. All other sectors are moving down. This happens because technology makes up a large part of the S&P 500.
Momentum Is Slipping
Recently the technology index started losing its push. It is also losing relative strength. On the RRG it is moving down and pointing left, which means a weaker outlook.
At the same time, many other sectors are gaining strength. Health care and financials are even moving into a better zone.
Inside the Technology Sector
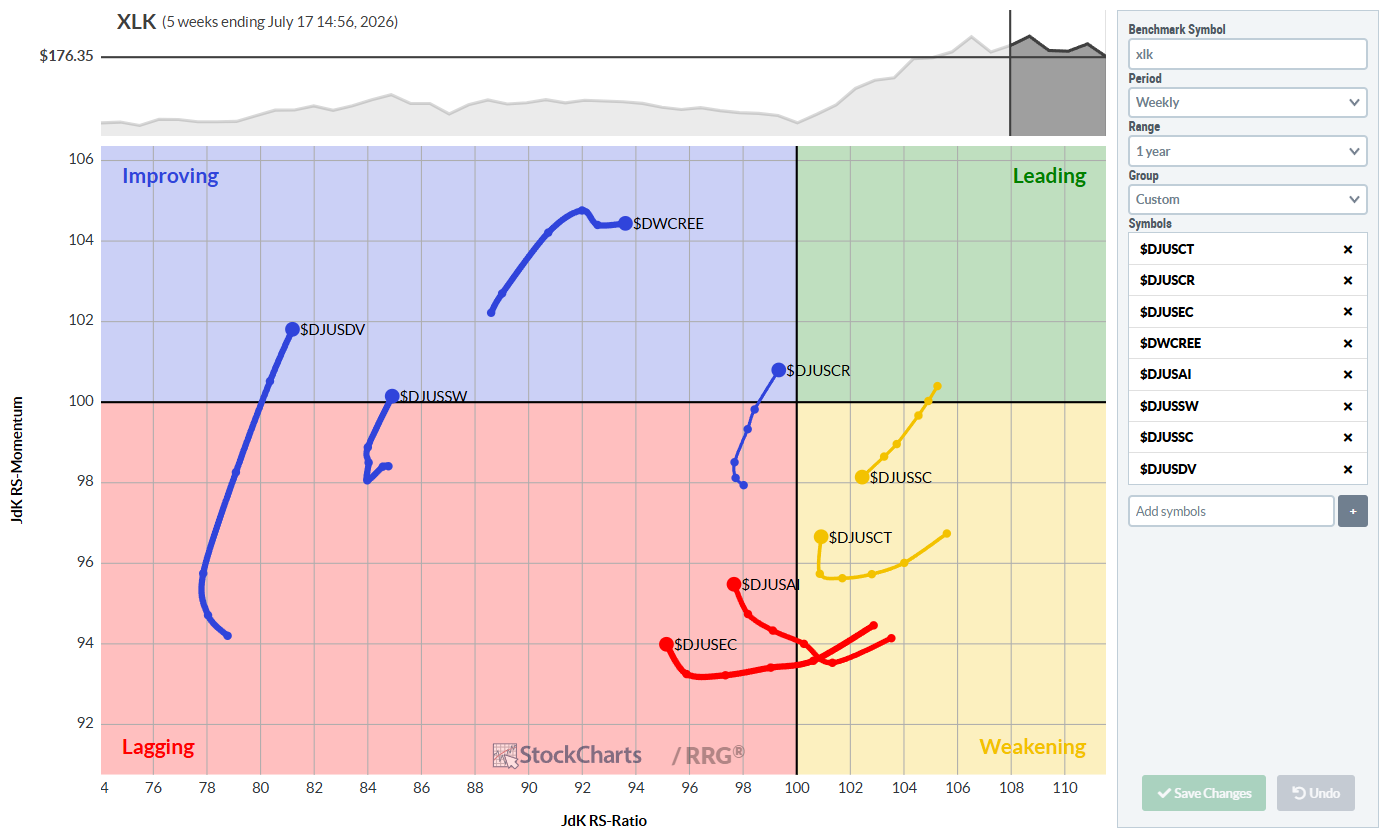
When we look closer, semiconductors are the biggest driver. They carry the most weight in tech and have been the main reason for recent gains.
Other groups are starting to improve. Telecommunication equipment is climbing back up, computer hardware is near the leading zone, and renewable‑energy equipment is also gaining.
Computer services and software are still low but are moving upward.
Tech, the Mag 7, and Semiconductors
Comparing the technology ETF (XLK), the Mag 7 ETF (MAGS), and the semiconductor index ($SOX) against the S&P 500 shows three clear trends.
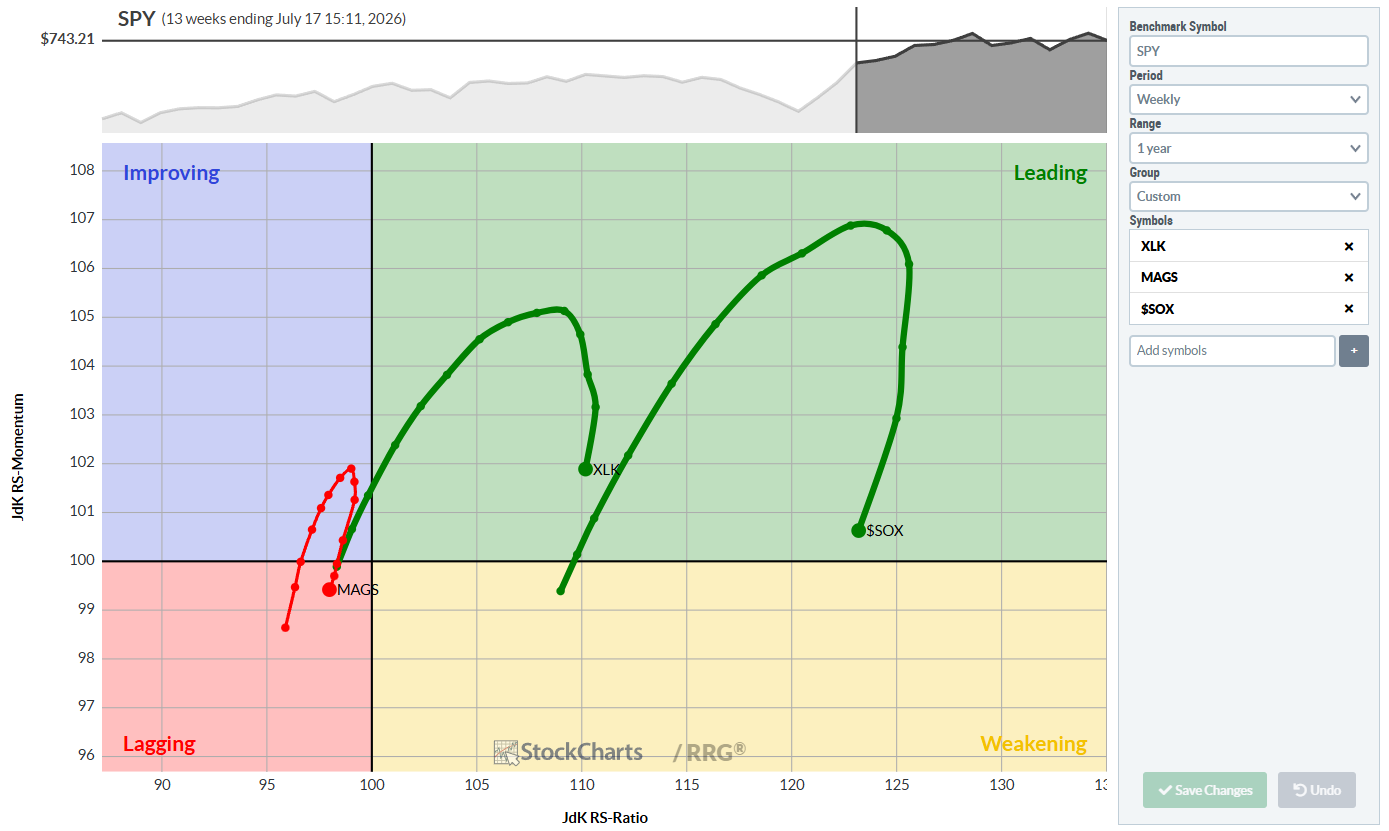
- MAGS: Falling into the lagging zone without ever reaching the leading zone.
- XLK: Losing both momentum and strength.
- $SOX: Still in the leading zone but slipping quickly.
Will Other Sectors Fill the Gap?
Money is moving out of technology and semiconductors and into health care and financials. The big question is whether these inflows are enough to lift those sectors and keep the S&P 500 steady or higher.
Individual Chart Snapshots
XLK (Technology)
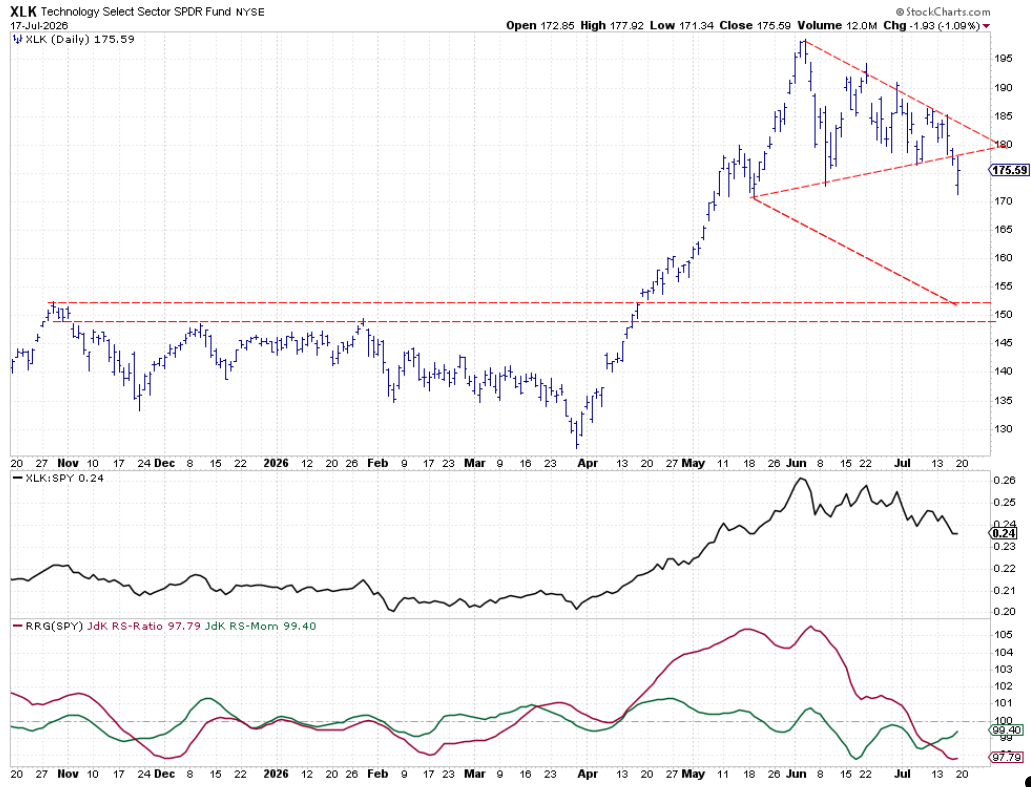
On the daily chart, the technology index is breaking down from a large symmetrical triangle. This pattern often signals weakness. The next downside target is around 150‑155, matching past support levels from 2020, 2025, and early this year. If support near 170 fails, the price could slide to the 150‑155 range.
MAGS (Mag 7)
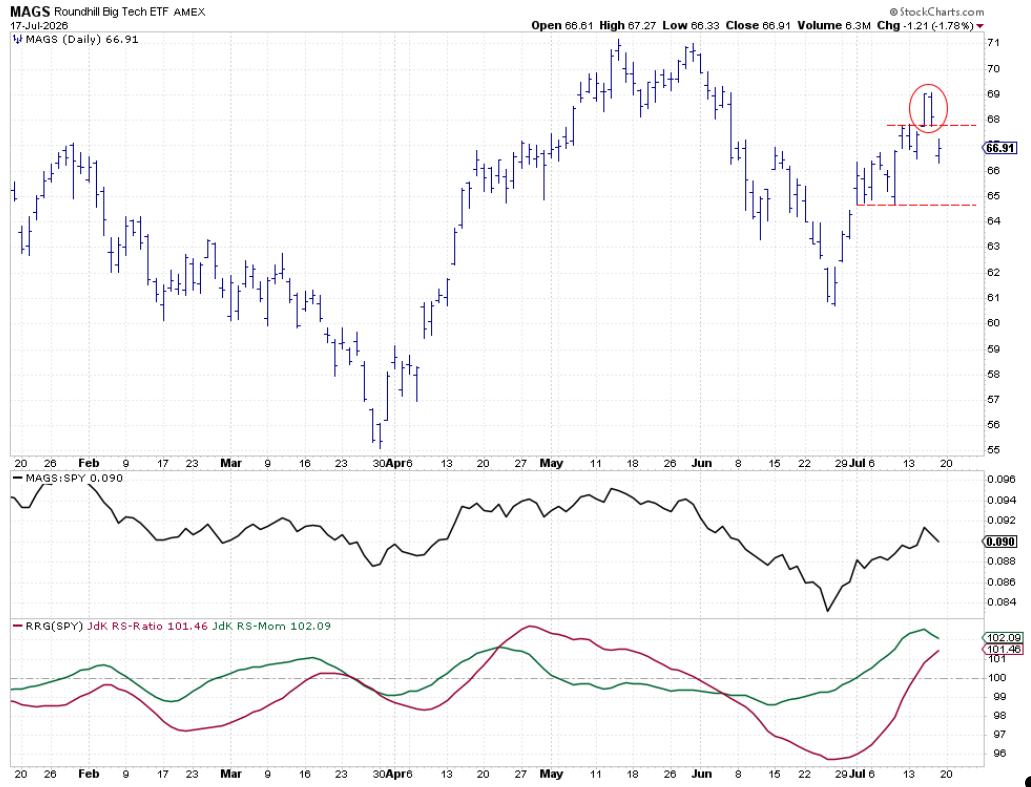
The daily chart shows a two‑bar island reversal. Resistance sits near 68, while support is around 64.6. The pattern does not look very bullish.
$SOX (Semiconductors)
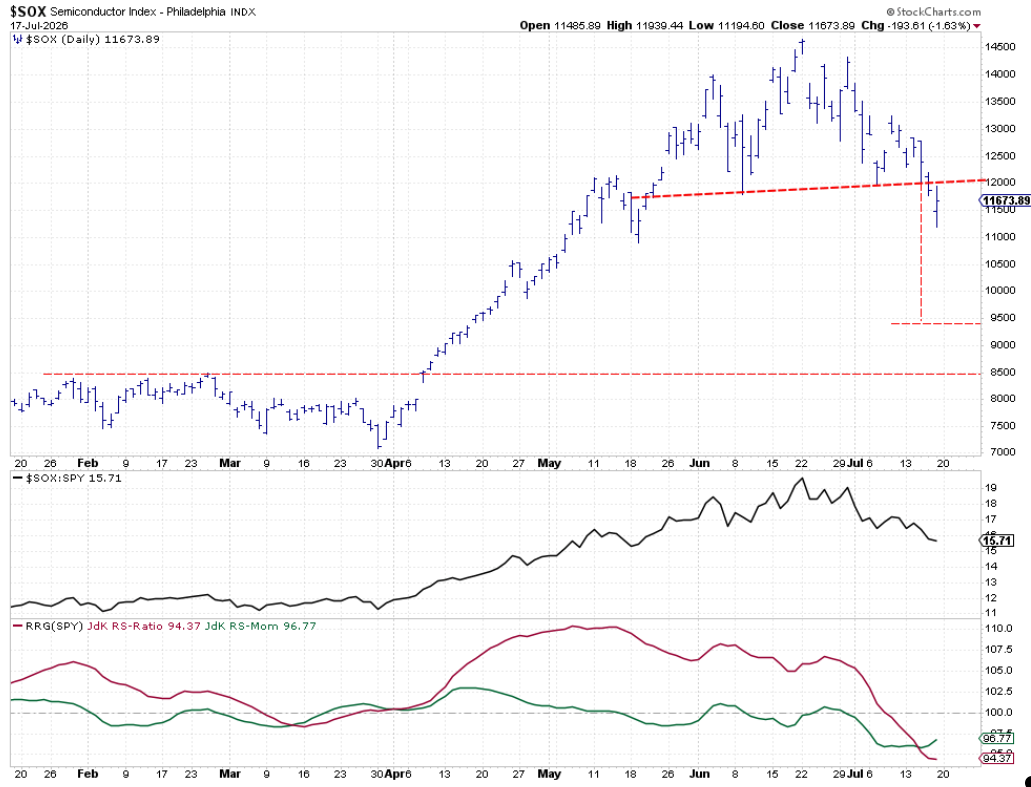
The semiconductor index shows a classic head‑and‑shoulders pattern over the past two months. The neckline near 12,000 was broken and now acts as strong resistance. The next downside target is just below 9,500, with solid support around 8,500.
Can the S&P 500 Hold Without Tech?
A clear rotation is happening: money leaves technology, semiconductors, and the Mag 7, and moves into other sectors. Because technology makes up a huge part of the S&P 500, it will be hard for the index to stay steady or rise without its help. Four of the Mag 7 stocks are not in tech, showing a broader shift away from large‑cap growth names.
#StayAlert
Source: Materials provided by https://articles.stockcharts.com.Note: Content may be edited for style and length.