

Industrials Drag Performance
The broad market (SPY) rose a little under 1% this week. Our sector mix, however, added negative pressure, widening the gap with the S&P 500 to about 8%.
The biggest drag came from Industrials, which posted a sharp decline compared with other groups.
How Rankings Shifted
- Technology stays on top.
- Industrials sit in second place.
- Health Care jumped from sixth to third.
- Financials moved up to fourth.
- Real Estate fell to fifth.
- Utilities rose to sixth.
- Materials dropped to seventh.
- Consumer Staples held at eighth.
- Consumer Discretionary climbed to ninth.
- Energy slid to tenth.
- Communication Services stayed at the bottom.
Portfolio Weight Changes
Health Care’s surge matters because it is a big sector (about 13% of market cap). This move cut Technology’s share from 59% to 53%.
Current weights are:
- Technology – 53%
- Industrials – 12%
- Health Care – 13%
- Financials – 19%
- Real Estate – 3%
- Utilities – (small)
- Materials – (small)
- Consumer Staples – (small)
- Consumer Discretionary – (small)
- Energy – (small)
- Communication Services – (small)
Weekly Relative Rotation Graph (RRG)
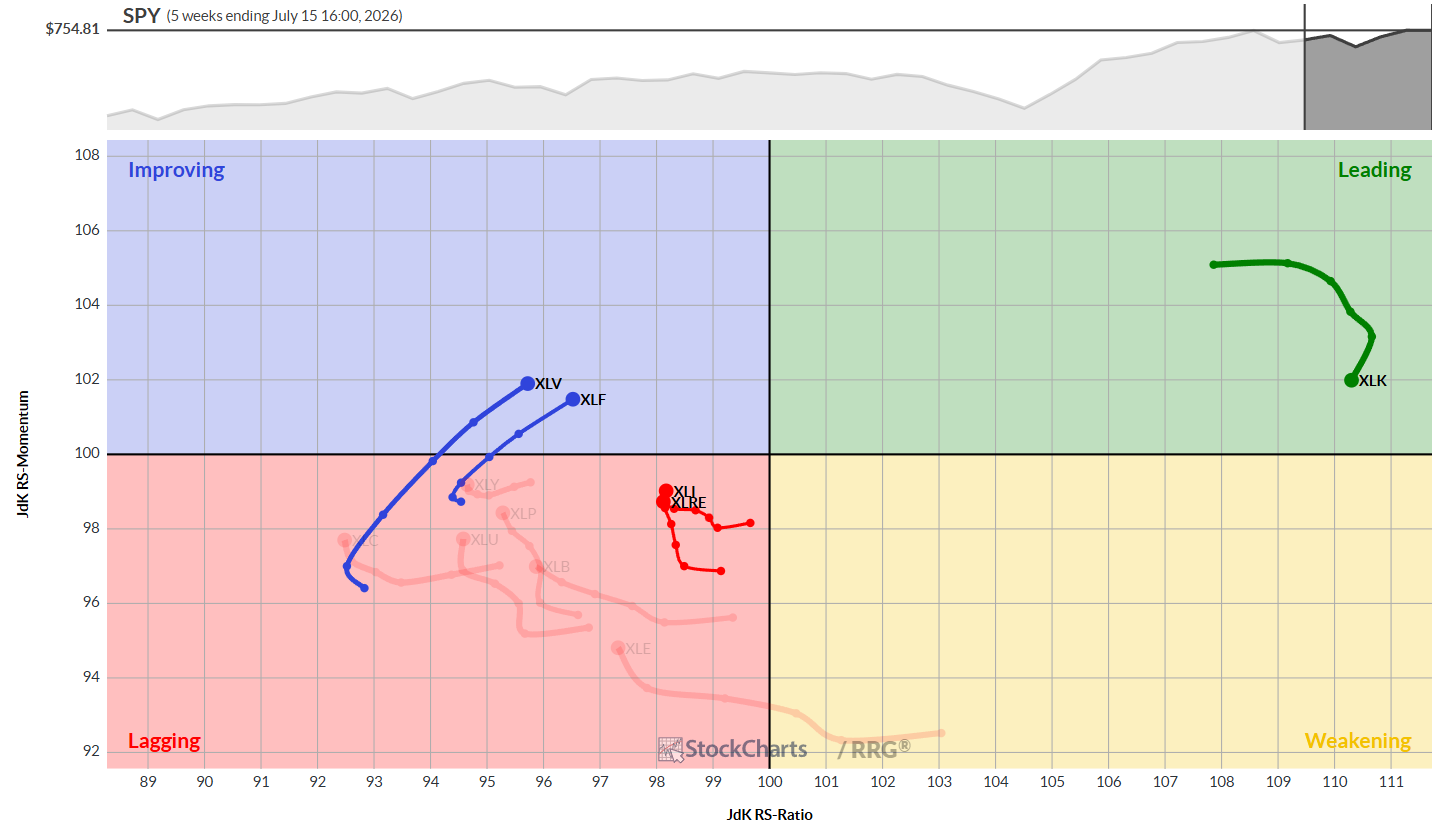
- Technology stays in the leader zone but is losing short‑term momentum.
- Health Care and Financials are moving into the improving zone.
- Industrials and Real Estate remain lagging but are gaining some strength.
Daily Relative Rotation Graph (RRG)
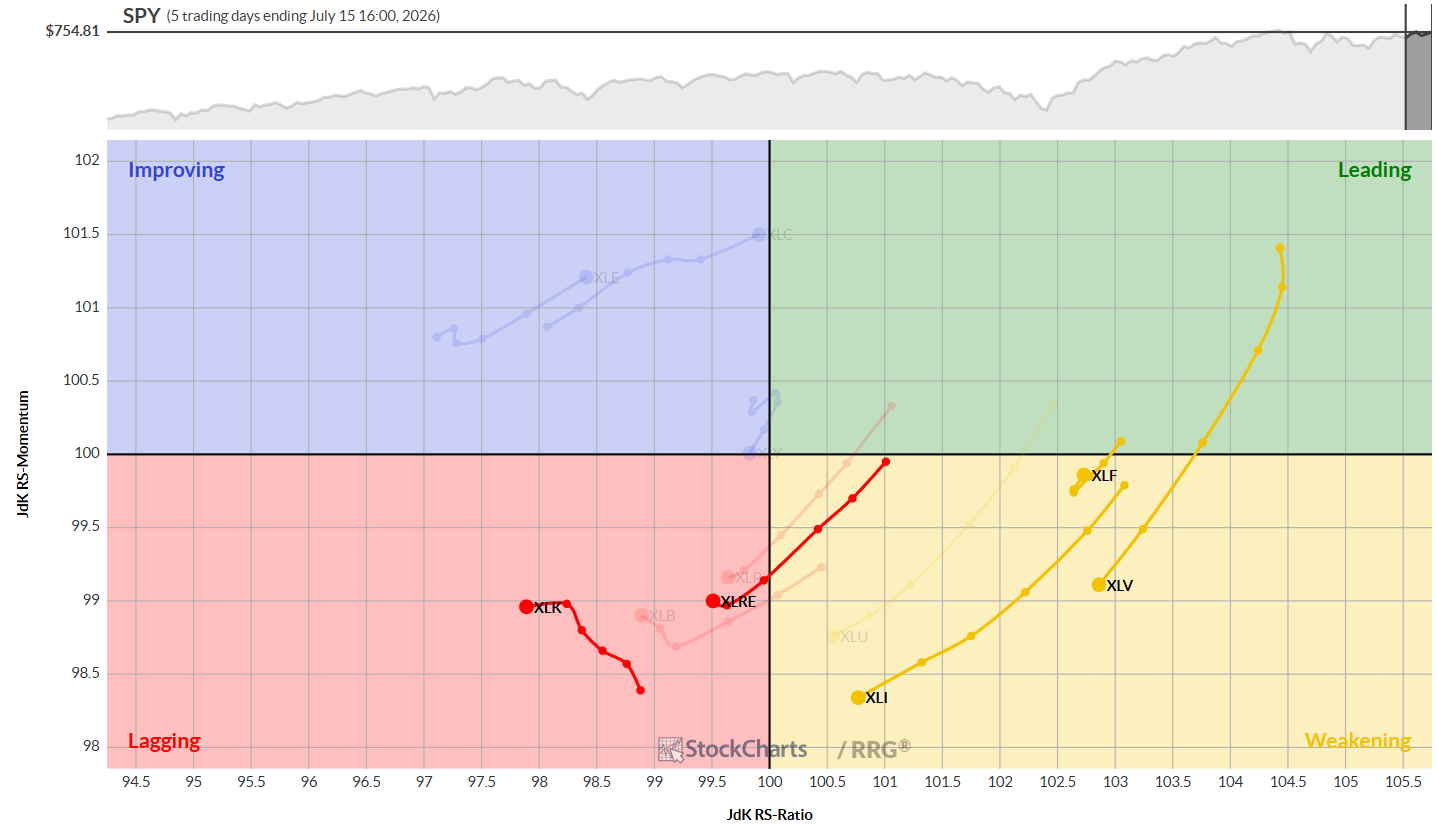
- Technology drifts further into the lagging zone, yet its weekly strength keeps it on top.
- Real Estate stays lagging on both time frames and fell in rank.
- Industrials and Health Care are in the weakening quadrant; Health Care’s weekly bounce may be temporary.
- Financials show a strong upward move inside the weakening zone, a positive sign.
Sector Spotlights
Technology
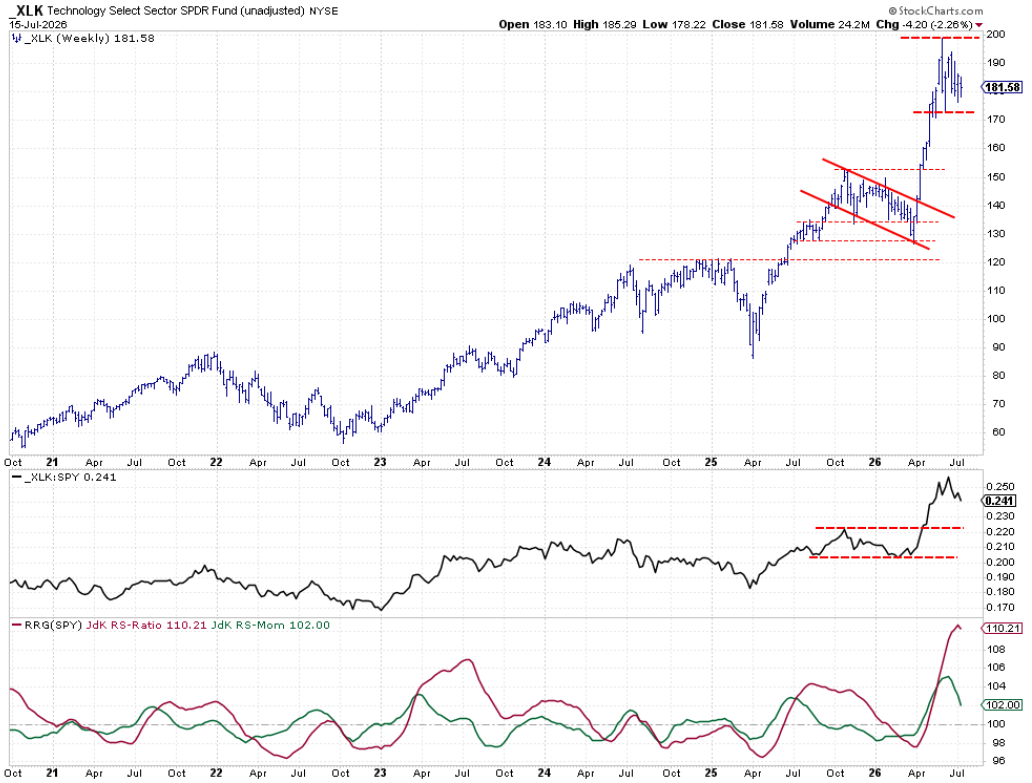
Tech prices are moving flat. The raw relative‑strength line is turning down, but the sector still holds a five‑year high RS ratio.
Industrials
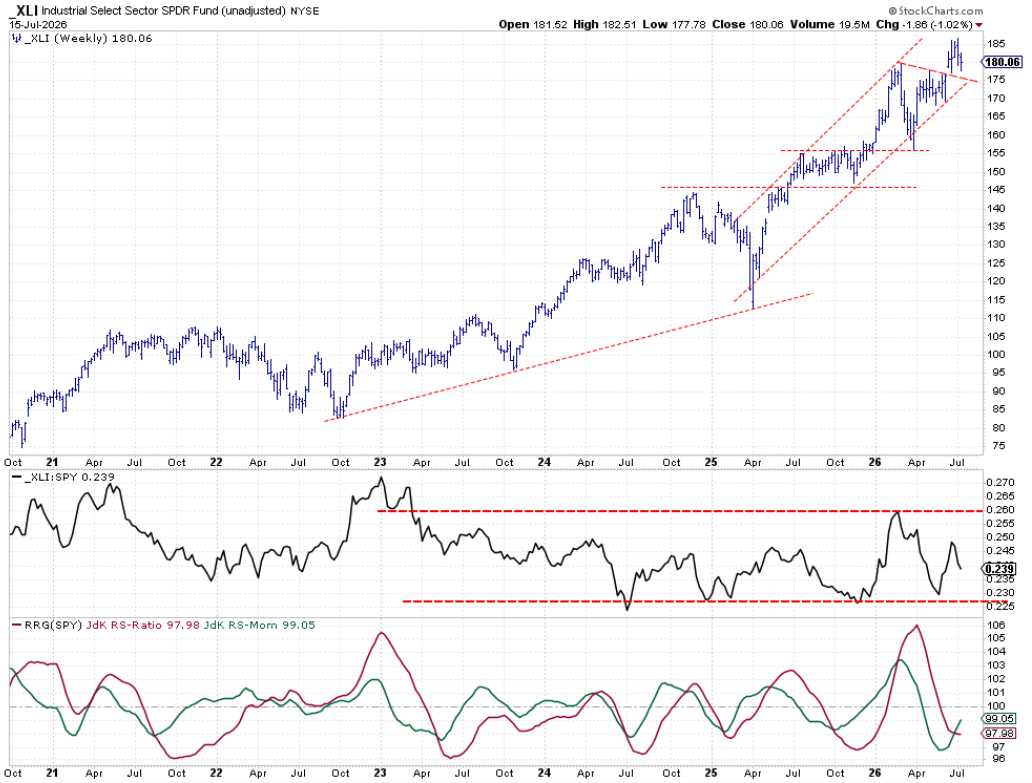
Industrials have broken out and are in an uptrend. The raw RS stays in a broad range while momentum climbs toward 100.
Health Care
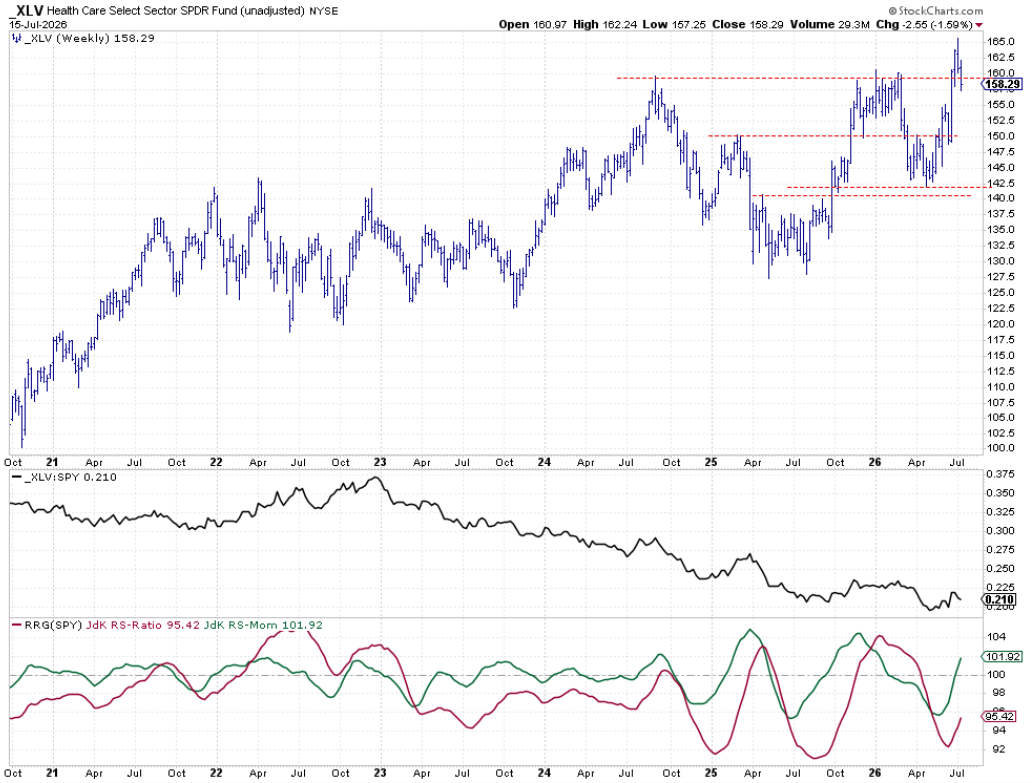
Health Care surged last week and now meets earlier resistance. The raw RS line is still below its prior high, but both RRG lines are rising.
Financials
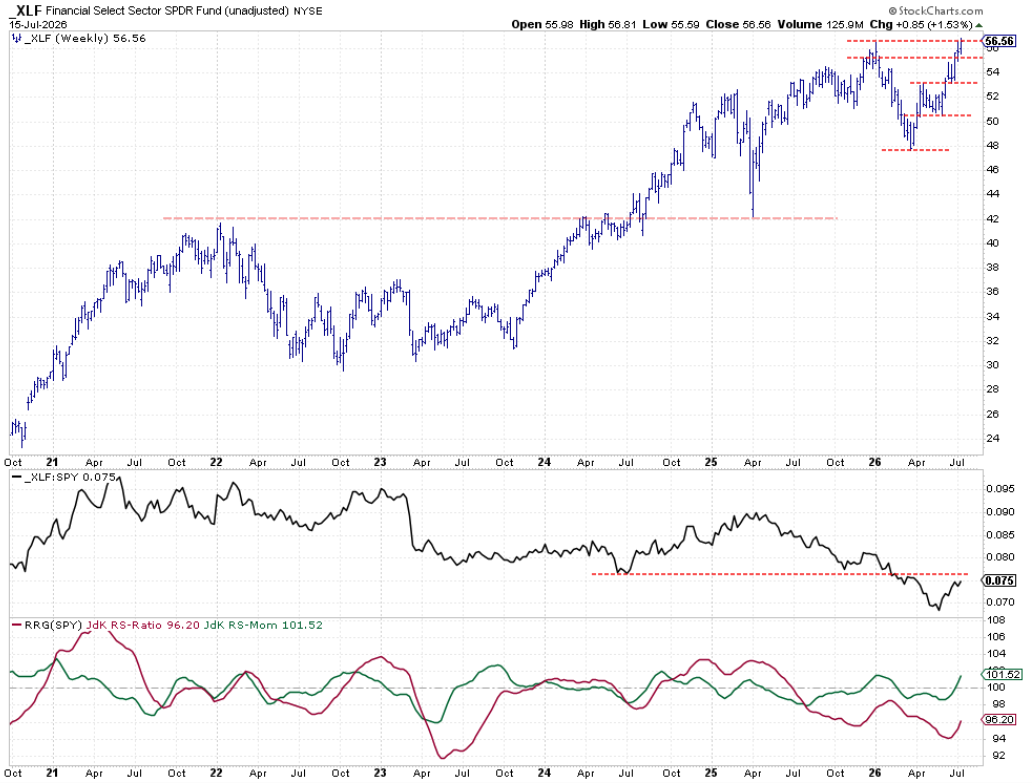
Financials moved higher in the rankings and are testing resistance around 56.5. A breakout could lift the RS line further.
Real Estate
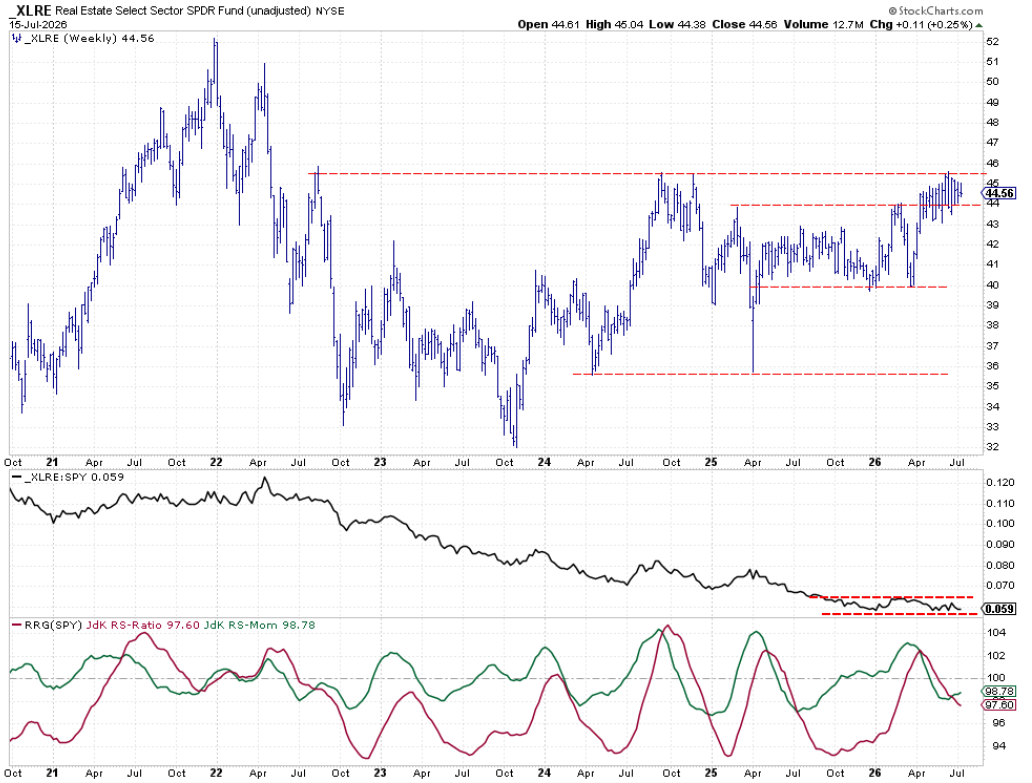
Real Estate has been stuck between 44 and 45.5 for weeks. Momentum is beginning to climb, but the RS ratio must follow to keep the sector in the top five.
Portfolio Performance Overview

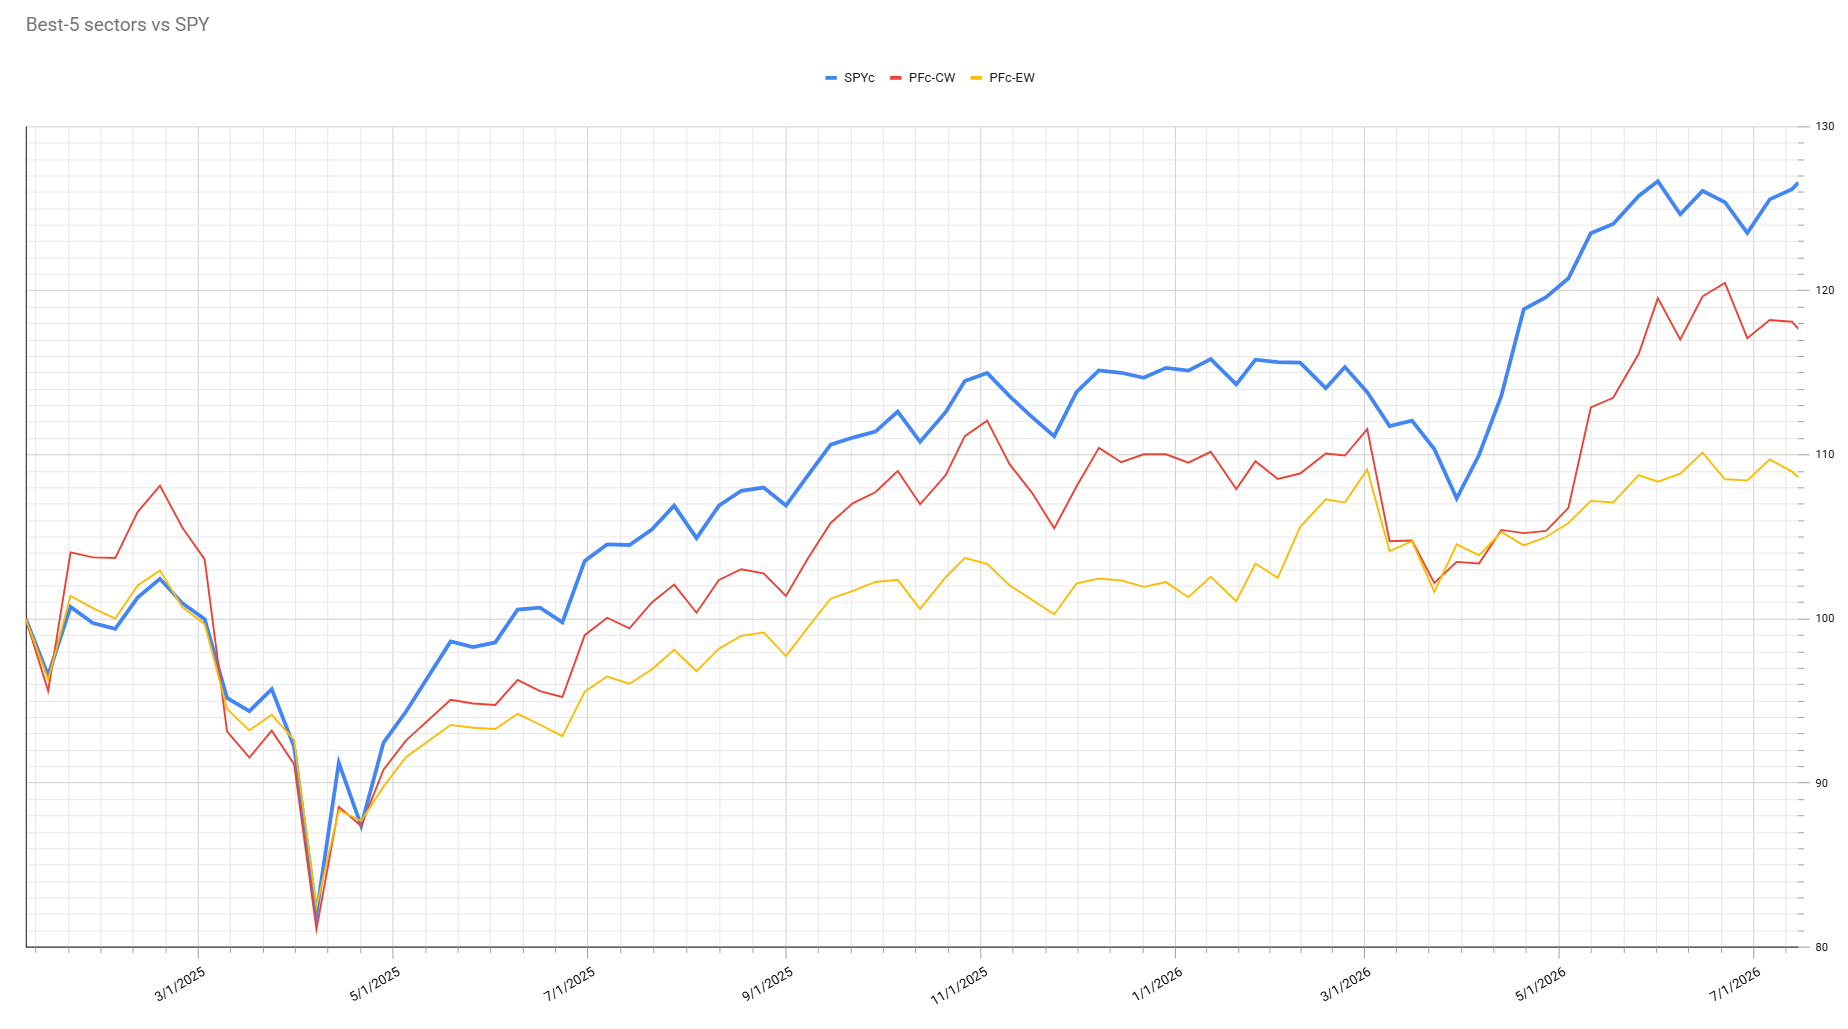
The portfolio lagged the S&P 500 by about 8% this week. Both lines moved up, but the benchmark stayed ahead.
Going forward, the mix leans less on Technology and more on growth‑oriented sectors such as Industrials and Financials. Health Care, while often seen as defensive, is now playing a bigger role thanks to tech‑driven health stocks.
Source: Materials provided by https://articles.stockcharts.com.Note: Content may be edited for style and length.