

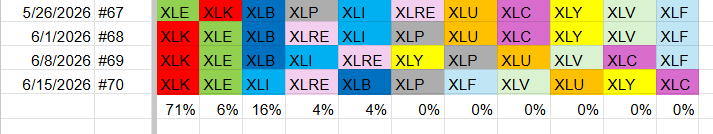
Last Friday the S&P 500 closed a little higher. After the market moved, nine of the eleven sectors changed places. Even with the shuffling, the same five sectors stayed at the top.
Top Five Sectors Hold Steady
Technology is still number one. Energy stays in second place. Industrials moved up to third, and Real Estate rose to fourth. Materials fell to fifth. The five‑sector group shows strong, consistent performance.
How the Other Sectors Shifted
- Consumer Staples moved to sixth.
- Financials jumped from the bottom to seventh.
- Health Care improved to eighth.
- Utilities slipped to ninth.
- Consumer Discretionary dropped to tenth.
- Communication Services fell to eleventh.
Weekly Relative Rotation Graph (RRG)
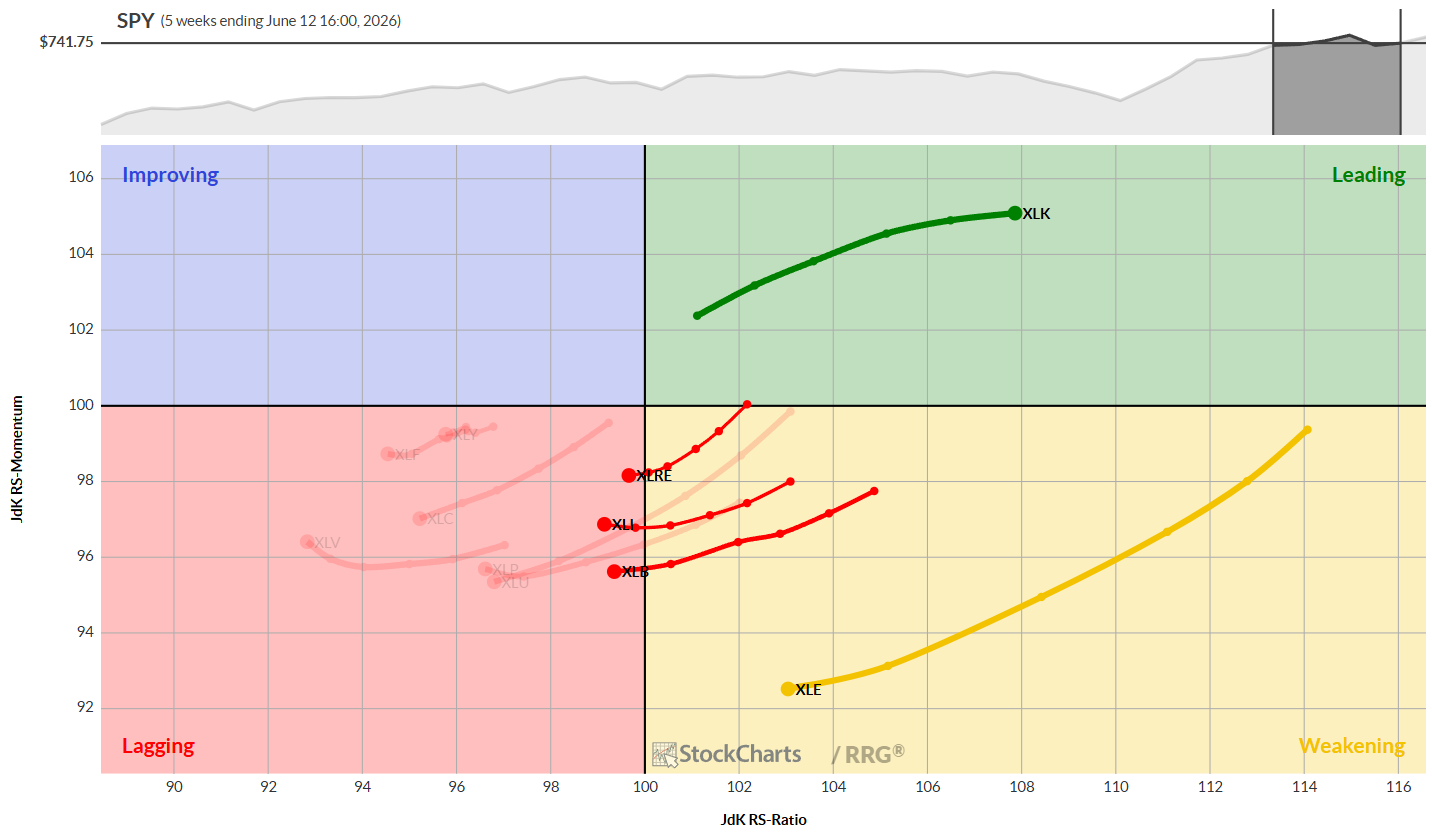
On the weekly RRG, Technology is deep in the leading quadrant. Energy is drifting toward the weakening area. Real Estate, Industrials, and Materials have just entered the lagging zone. No sector appears in the improving quadrant.
Daily Relative Rotation Graph (RRG)
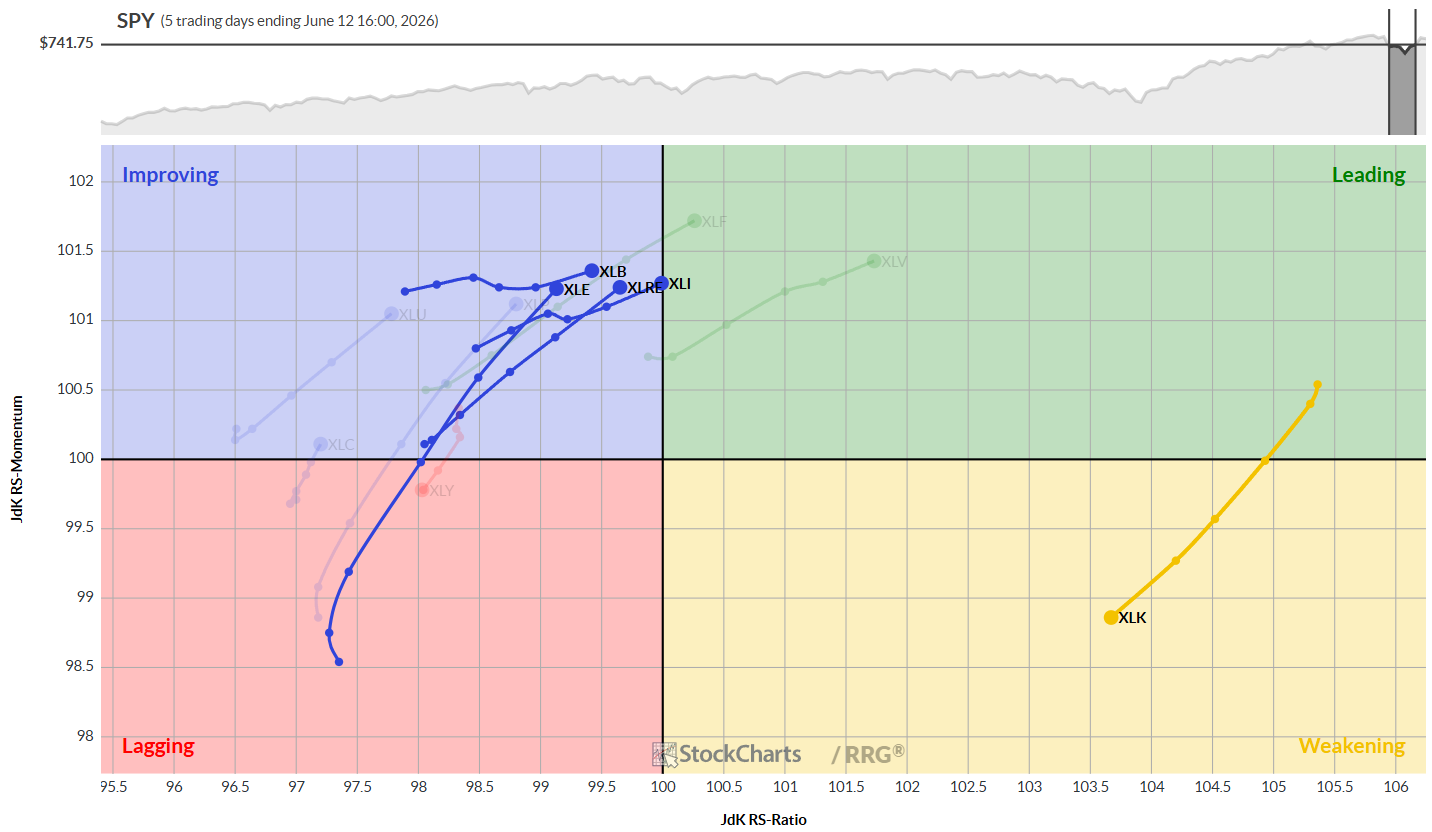
Today’s RRG shows Technology pulling back a bit but still strong. The other four top sectors sit in the improving quadrant and could move back into the leading area soon.
Sector Highlights
Technology
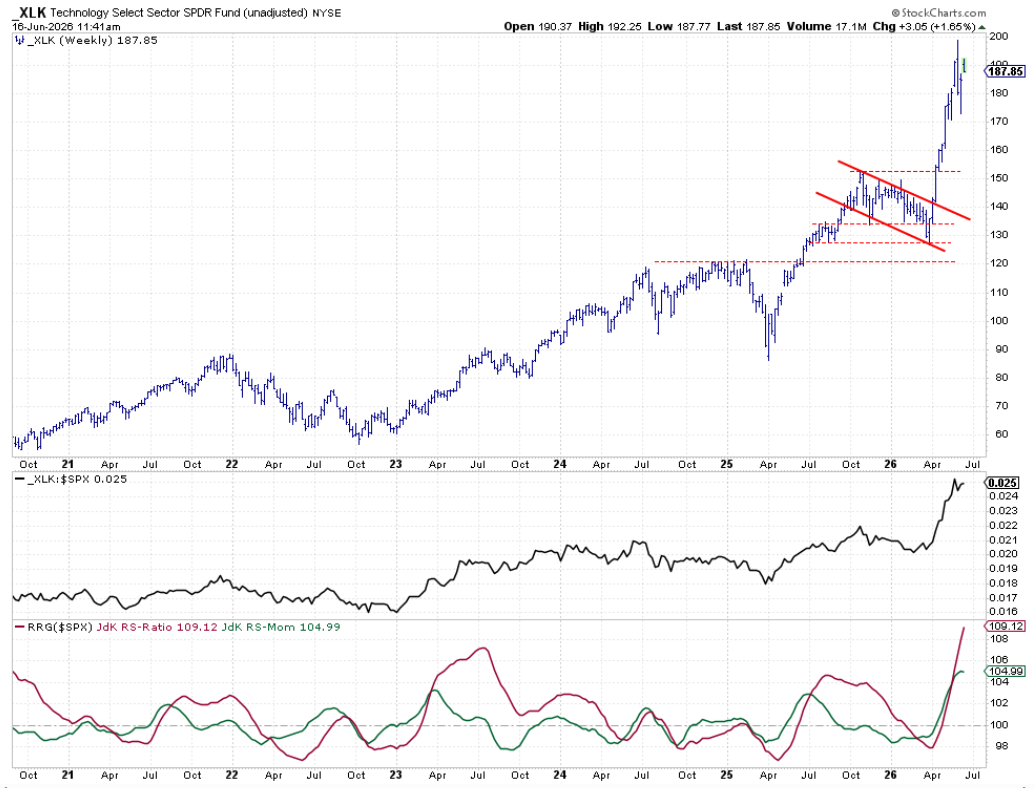
Tech keeps climbing. Its relative‑strength line is at the highest point in five years, and the price chart stays strong.
Energy
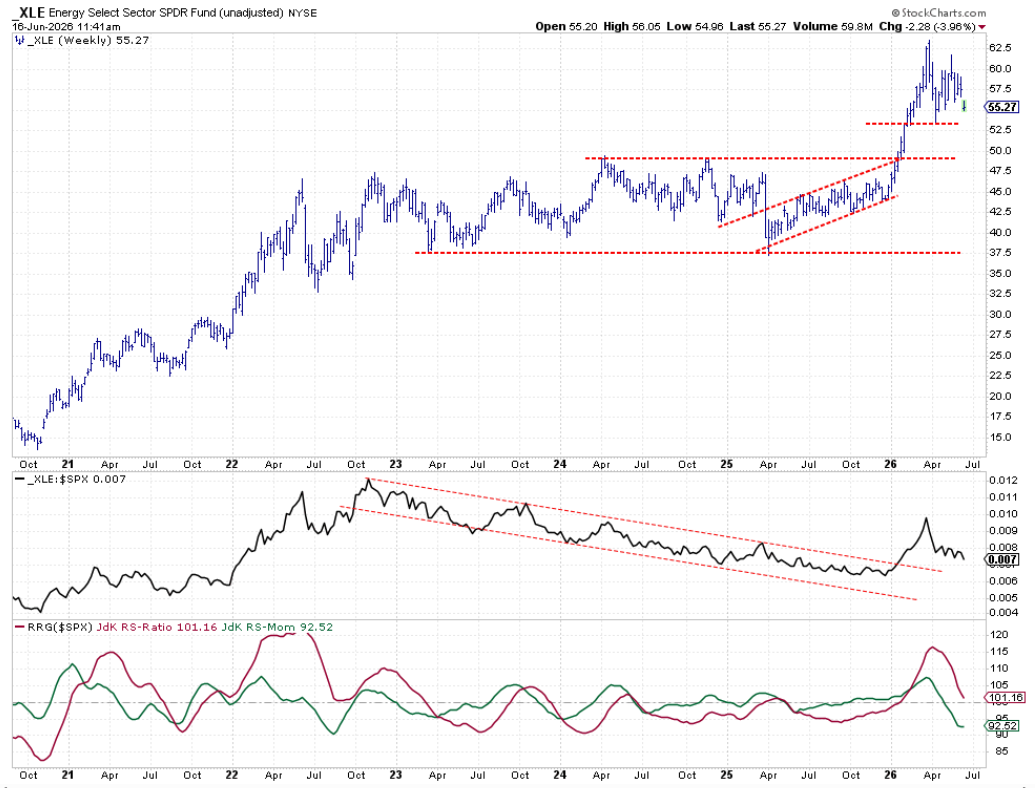
Energy is losing steam. It is falling out of a six‑to‑eight‑week range. The strength line is sliding and may soon drop below a key level, which could push it into the lagging zone.
Industrials
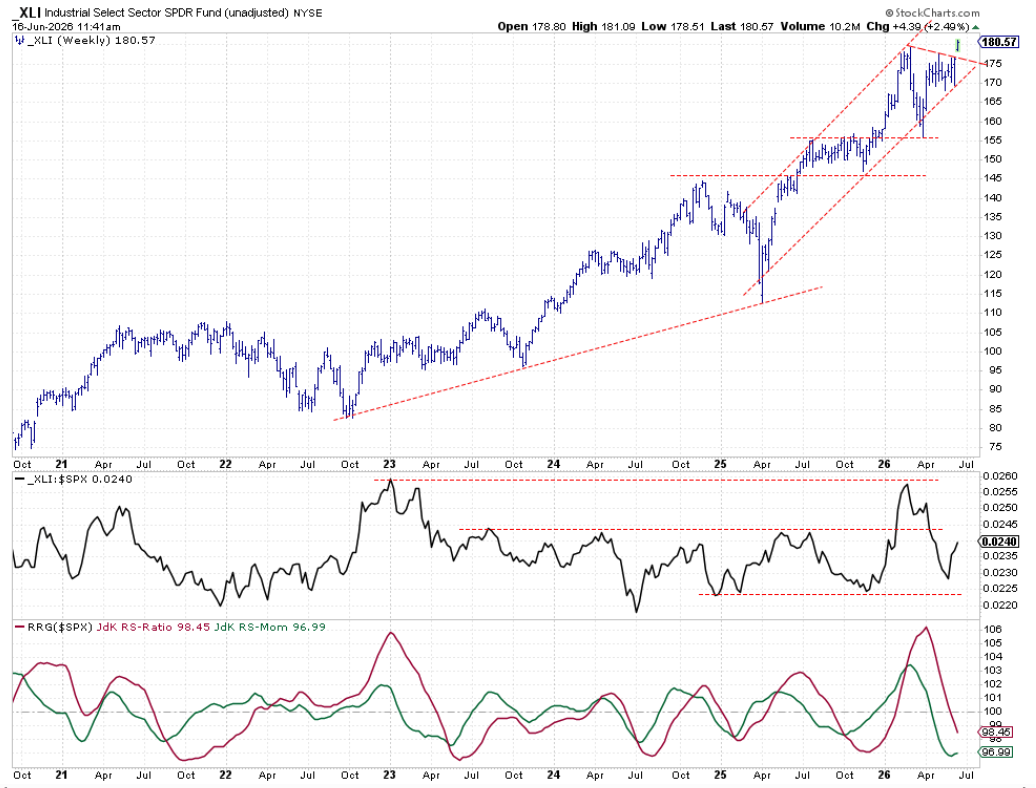
Industrials broke out of a flat pattern and hit new highs. The strength line is rising sharply, which should help the sector keep moving up.
Real Estate
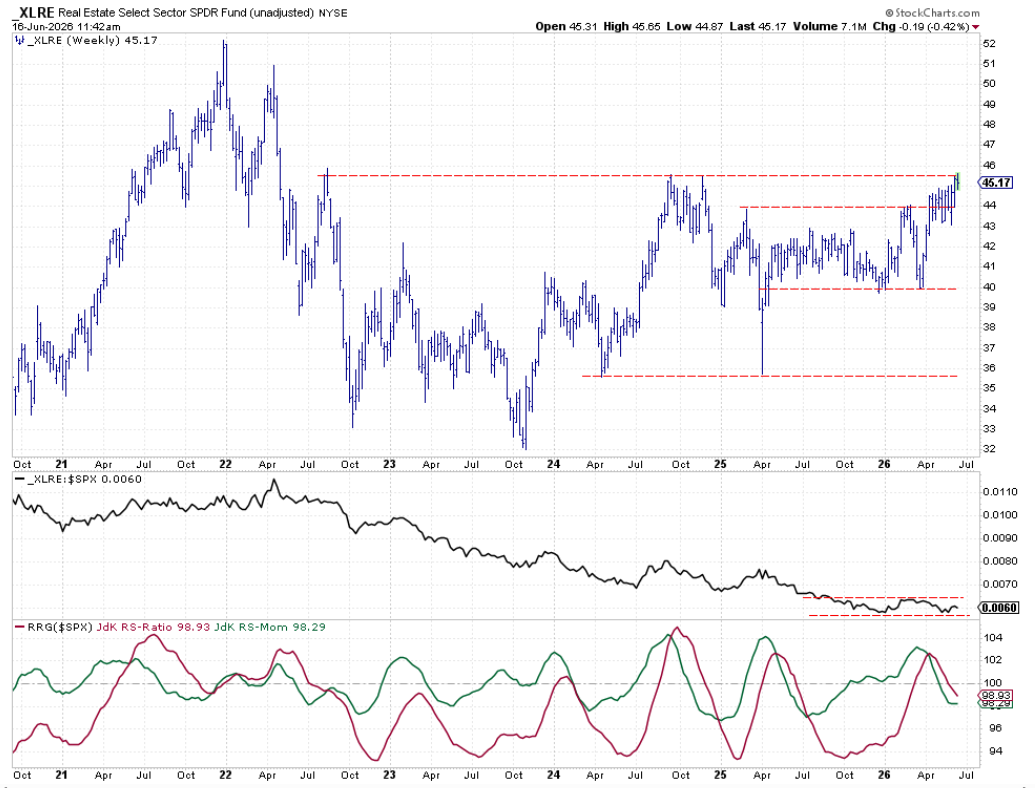
Real Estate is climbing and testing a barrier just above 45. A break above could let it rise toward the 2021 high near 52.
Materials
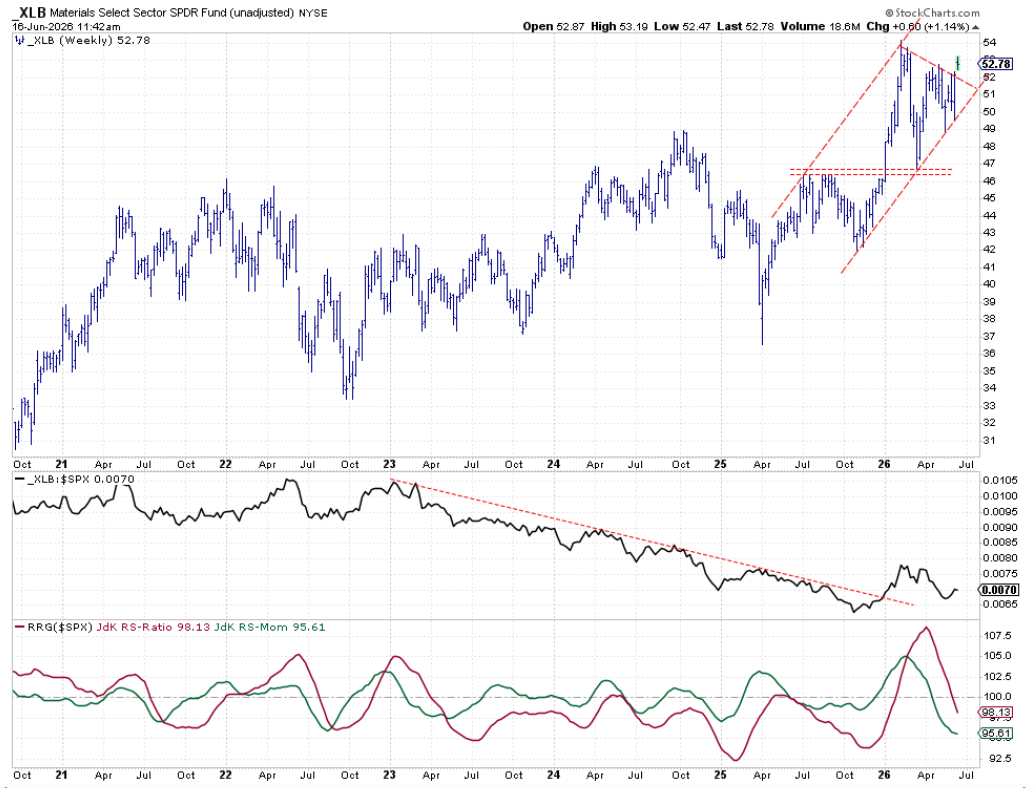
Materials left its old range but stayed inside an upward‑sloping channel. The strength line made a higher low, showing a better outlook.
Portfolio Performance
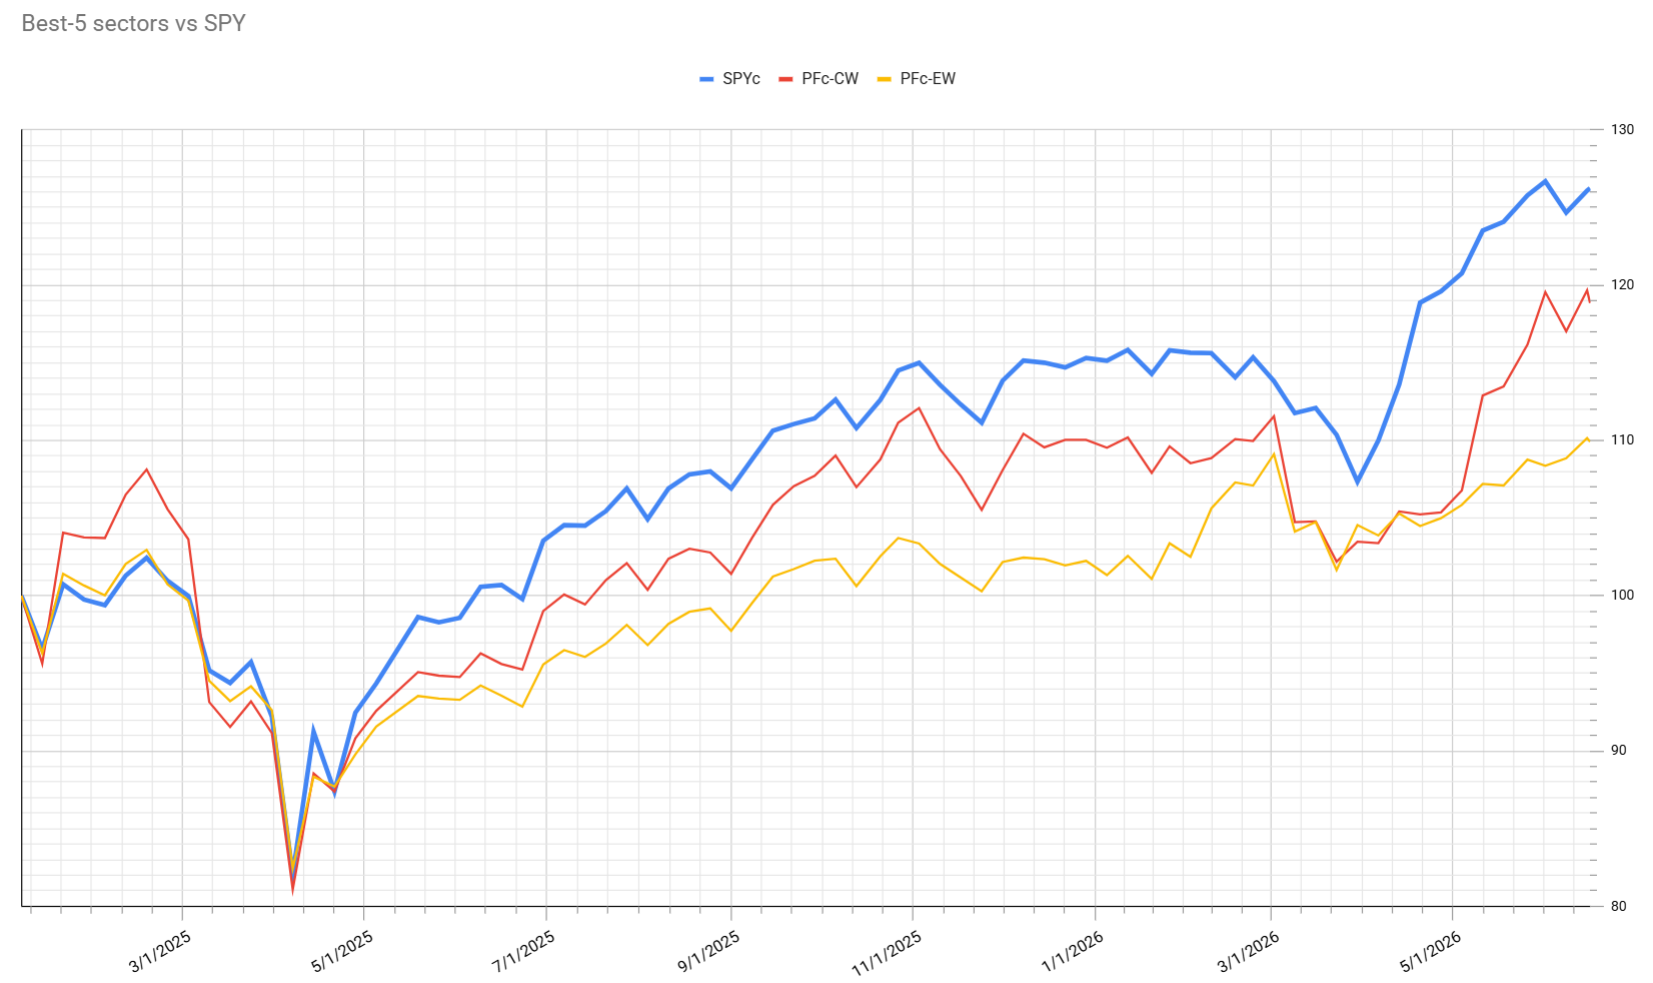
The portfolio kept the same weightings. This week it outperformed the S&P 500 by 1.2%, narrowing the gap from 7.6% to 6.4%.
Source: Materials provided by https://articles.stockcharts.com.Note: Content may be edited for style and length.