
Before we start…
Imagine you see a clear pattern on a chart – maybe a smooth rise and pull‑back, a triangle, or a rectangle. It looks perfect for a swing trade. You jump in, but then you wonder: how far might the price go? Where should I set my profit goal?
If you’re not sure, this guide will show you a simple way to estimate targets using a measured‑move idea.
What Is a Measured Move?
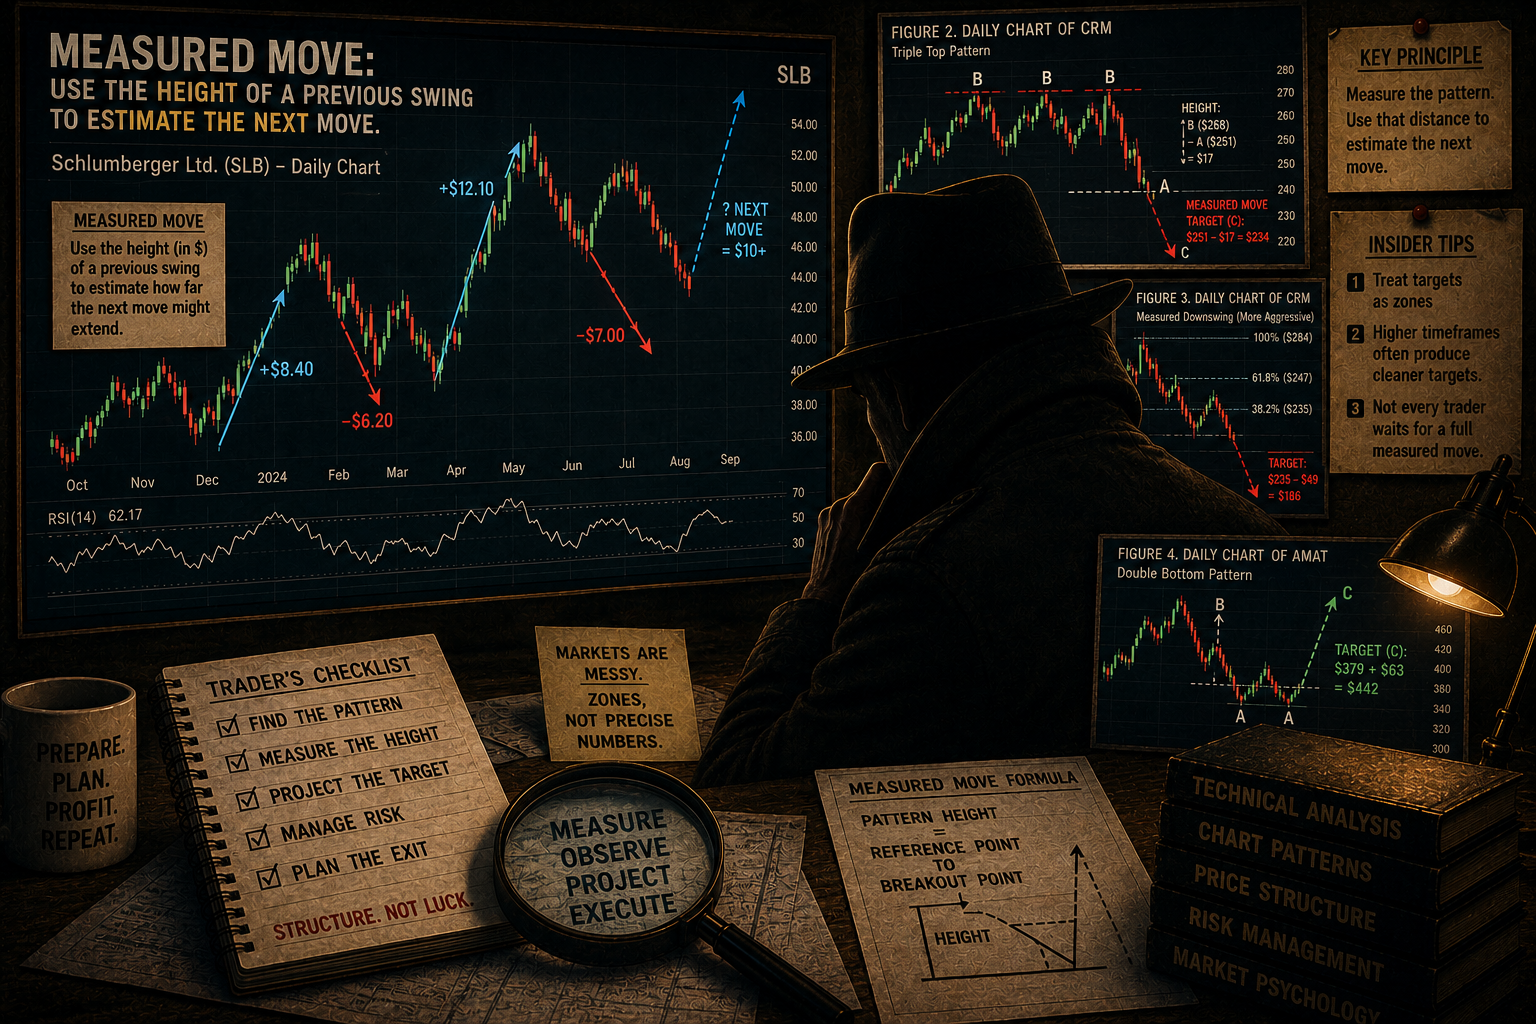
A measured move is a trick traders use to guess the next price distance by looking at the size of a recent swing or pattern. In plain words, you copy the height of a past move and project it forward to set a target.
The method works best when the market repeats similar moves, but it’s not a guarantee. Let’s see a real example.
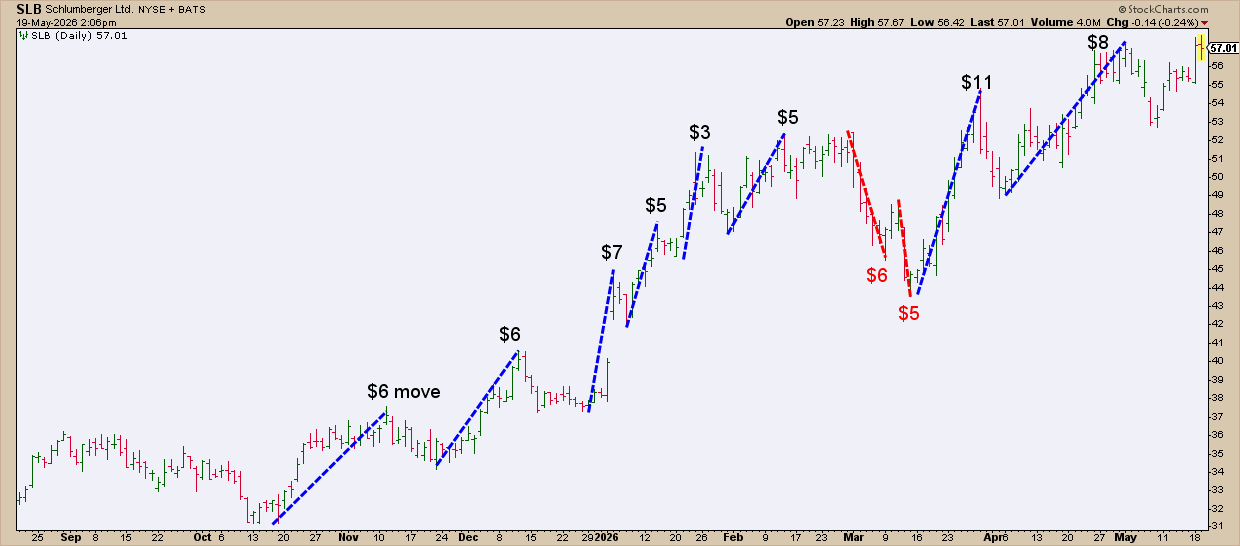
Look at the SLB chart. The upward legs (blue) and the downward legs (red) are fairly close in dollar size. That similarity lets us use the recent swing as a ruler for the next move, even though the price may not reach the exact distance.
Measured Moves Are More Art Than Math
Counting the exact distance is easy, but deciding what to count is subjective. Two traders can look at the same picture and pick different points. Some use 15‑minute charts, others daily or weekly charts. Some aim for the full distance (100 %), while others settle for only part of it (60‑80 %). The key is to be consistent with your own rules.
How to Apply a Measured Move to Patterns
Most chart patterns can be measured the same way: find the pattern’s height, then add or subtract that height from the breakout point. Below are a few easy examples.
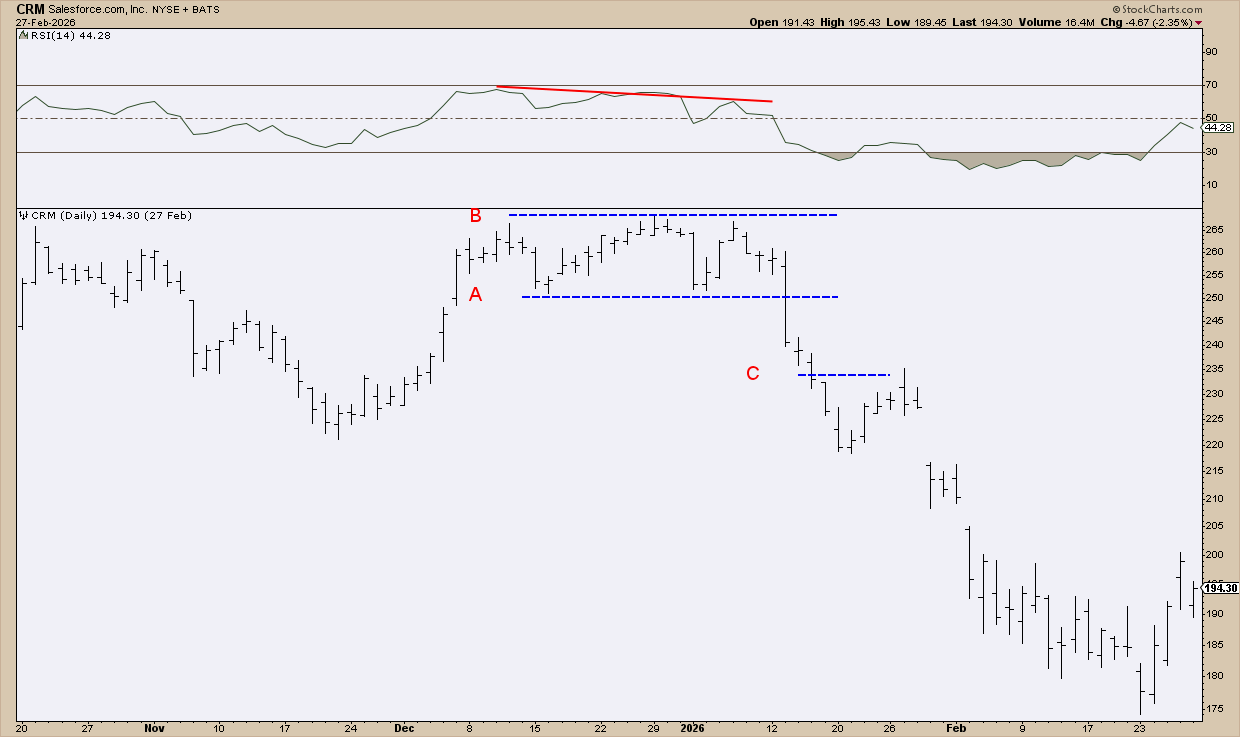
The triple‑top creates a short high (point B) and a low (point A). Subtract the low from the high: $268 – $251 = $17. If you expect a 100 % move, drop $17 from the breakout low. The target would be about $234.
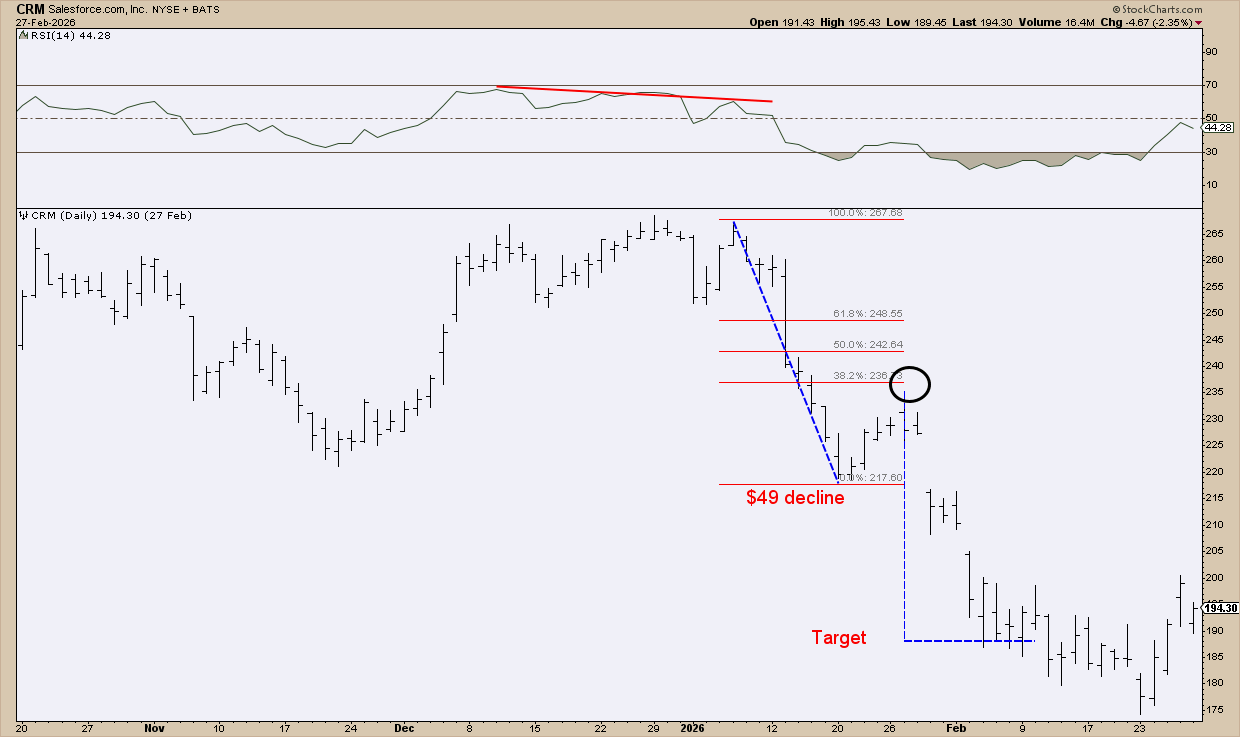
The full decline measured $49. A more aggressive trader could go short near the 38.2 % Fibonacci level, place a stop above the 61.8 % level, and set a profit target $49 below the recent high ($235). That gives a target near $186.
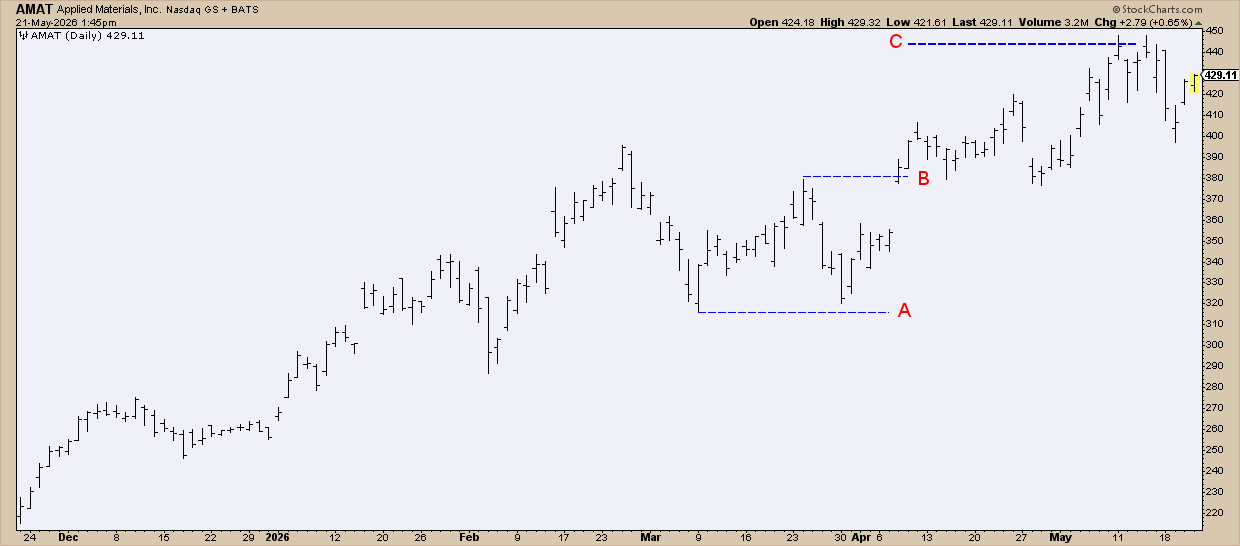
Here the low (A) is $316 and the high (B) is $379, a $63 range. Adding $63 to the high gives a 100 % target of about $442. Many traders will take profit earlier, perhaps when the price reaches 60 % of that move.
Tip 1: Think of targets as zones, not exact numbers. Prices can overshoot or reverse before hitting a line.
Tip 2: Use higher‑time‑frame charts (daily or weekly) for cleaner measurements. They contain less noise.
Tip 3: You don’t have to wait for the full move. Many traders exit after 60‑90 % of the projected distance to lock in profits early.
Wrapping Up
Measured moves are not magic predictions. They are simply educated guesses based on past price geometry. Sometimes the price lands right on your target, sometimes it goes past, and sometimes it falls short. The important part is that you have a plan, not a wild guess.
Source: Materials provided by https://articles.stockcharts.com.Note: Content may be edited for style and length.