

Last week Elon Musk celebrated a big win. SpaceX shares jumped from about $150 to over $200 in just a few days. The stock will soon be added to some Vanguard index funds, but because only a few shares trade publicly, the amount added will be small. Traders should watch their risk, as the stock’s volatility is high.
The Bigger Picture: Changing Market Forces
SpaceX is only one piece of the puzzle. Looking at the whole market, oil prices have slipped below $80 a barrel, and the chance of a Middle‑East truce is fading. This shift can change how different markets move together.
Historically, commodities and interest rates tend to rise together. Since early March we have seen that link play out in energy and farm products.
Now that the broader commodity rally is cooling, precious metals have found a small floor. Gold and silver have struggled since their January peaks, mainly because real interest rates have risen and the fast price climb at the start of the year has slowed.
Is it time to put more weight on shiny metals again? Let’s check the charts.
Gold Still Needs a Push
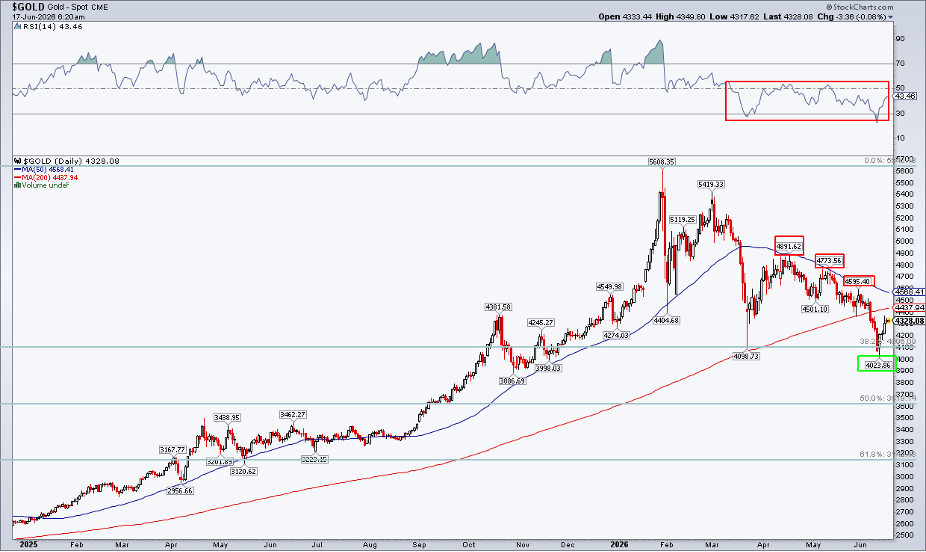
Gold is still below its long‑term 200‑day moving average, and a “death cross” (the short‑term average falling below the long‑term one) looks likely soon. The 50‑day line has acted as resistance three times this spring. A clear break above that line would be a positive sign.
The RSI momentum indicator is stuck in a weak zone between 25 and the low 50s, indicating a defensive stance. There was a brief dip below $4,099 in March, but the rebound was modest.
Support is forming around $4,000‑$4,100, which matches the 38.2% Fibonacci level from the rally that began in late 2023.
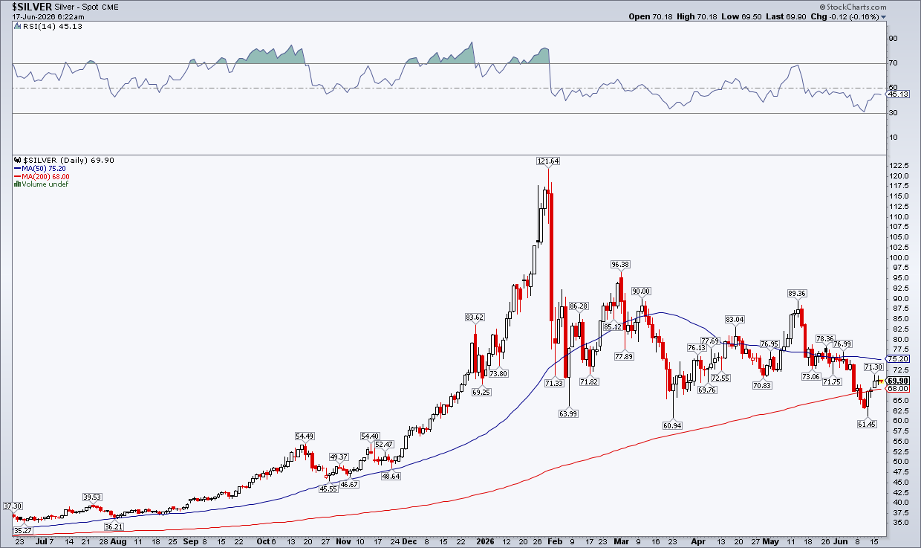
Silver Looks a Bit Brighter
Silver is doing slightly better. It stayed above its 200‑day average and held its March low earlier this month. A fake rally from just above $70 to nearly $90 in late April hurt the price, but if the $61 level holds, another bounce could happen.
The Real Challenge
Why haven’t gold and silver returned to their 2025 highs? A hot economy may be the answer. Higher oil prices pushed nominal Treasury yields up in the second quarter, and real yields (TIPS) have been jumpy since mid‑May.
Many factors affect precious metals, but real yields are often the most important driver.
Why Gold Miners Might Benefit
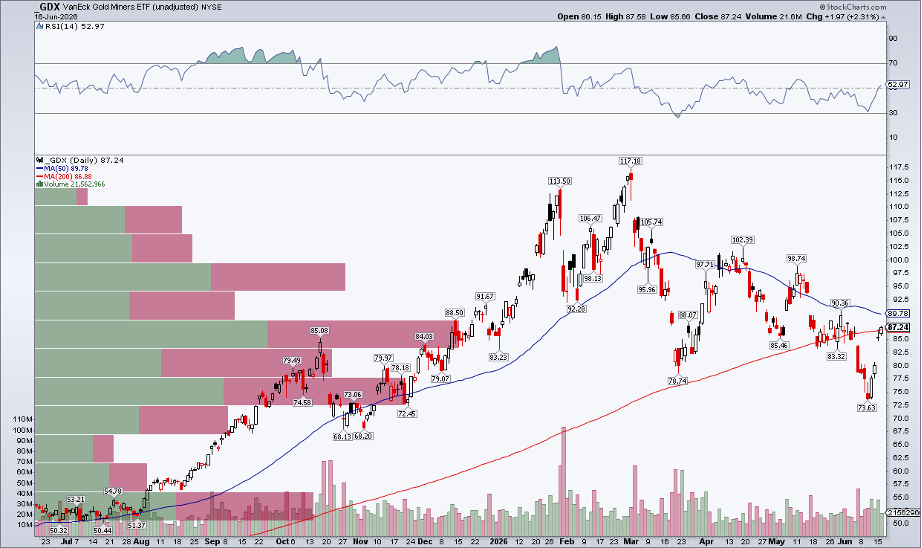
Lower energy prices and stronger growth prospects can help capital‑intensive gold miners. The VanEck Gold Miners ETF (GDX) is up about 18% from its June low and has moved back to its 50‑day moving average.
A death cross is still possible for the metal, but GDX shows a more hopeful pattern. A weekly close above the 200‑day average would be encouraging, and better relative strength this summer would help.
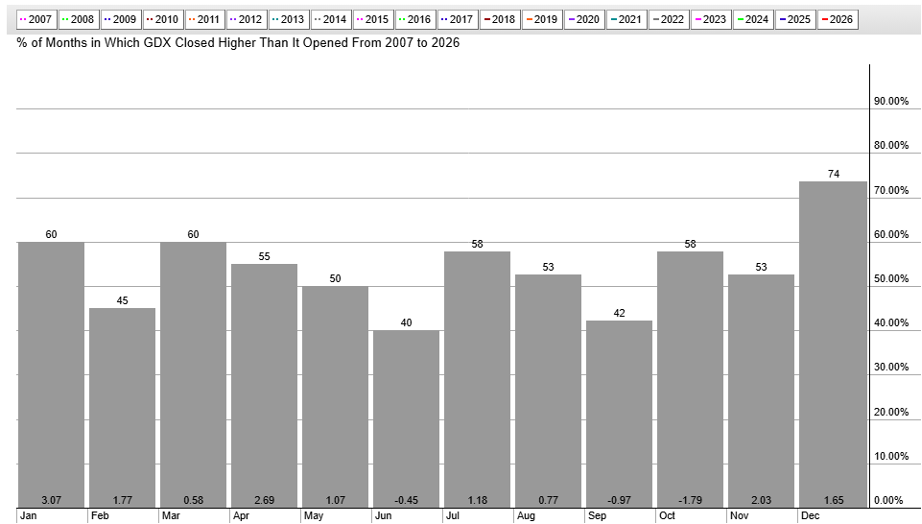
Seasonal Help for Miners
Historically, July and August are strong months for GDX. From 2007 to 2025, the average July gain was 1.2% and August added another 0.8%.
Before the latest Fed meeting, GDX rose for four straight sessions, beating the S&P 500 each day. Implied volatility was modest at 44%, so traders did not expect a big surprise.
What Could Trigger a Move?
The overall market conditions are lining up for gold miners. Real rates are still a drag for pure gold and silver, but miners can still perform.
Watch upcoming economic data. Any sign of a softer labor market could lower real rates, giving a boost to precious metals. Past summers with weaker employment saw Treasury demand rise and the Fed lower rates.
Bottom Line
Think of gold, silver, and mining stocks as dark‑horse candidates for the middle of the year. Lower oil prices help, but the bond market is still stubborn. Technical damage from January to April needs to heal, and both absolute and relative strength must improve before a heavy portfolio tilt makes sense.
Disclaimer: This article is for educational purposes only and does not constitute financial advice. Always consider your own situation and consult a professional before acting.
Source: Materials provided by https://articles.stockcharts.com.Note: Content may be edited for style and length.