


Is the AI craze getting too hot? Wall Street is asking that question as we head into summer.
Last week the market jumped around. A strong jobs report pushed Treasury yields higher. The VanEck Semiconductor ETF (SMH) fell 9.2%, its worst day since January 2025. South Korea’s market dropped 14%, its biggest single‑day slide since the COVID lows. Emerging‑Markets ETF (EEM) also saw its biggest loss in more than six years.
Three Quick Tools for Any Trader
- Rate of Change (ROC) – Add the ROC indicator to a daily or weekly chart to see momentum.
- Market Carpet – A heat‑map that shows which sectors are winning or losing.
- Market Summary – Sort the equity list by daily % change to spot the strongest groups.
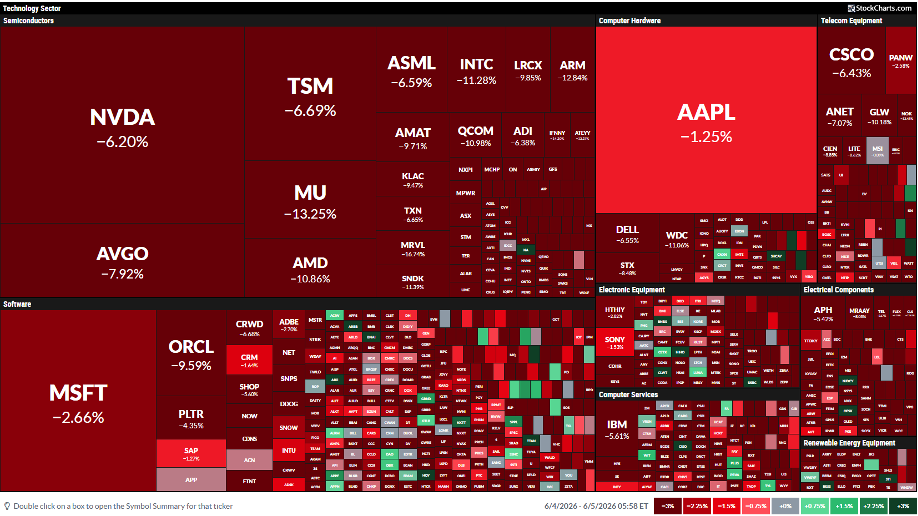
Friday Was Rough, Not a Total Collapse
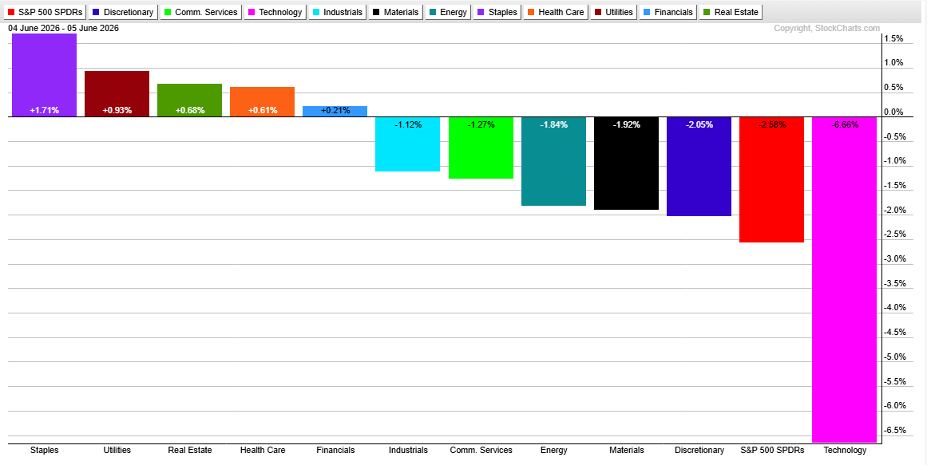
Friday’s sell‑off hit chips hard, but five of the eleven S&P 500 sectors still rose. Consumer Staples led with a 1.7% gain. Utilities, Real Estate, Health Care and Financials were also in the green.
Industrials fell 1.1%, which is far better than the S&P 500’s 2.64% drop – the biggest monthly decline in ten months.
Transport ETFs Lead the Pack
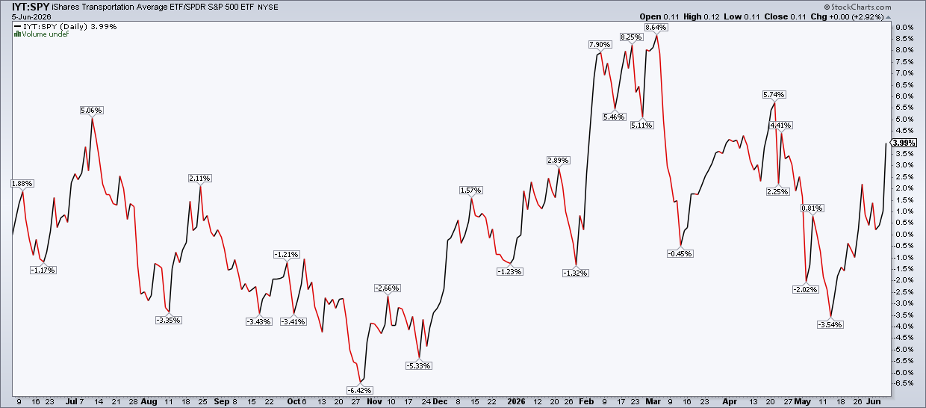
Within Industrials, transportation stocks stood out. The iShares Transportation Average ETF (IYT) closed at a record weekly high. This isn’t a one‑time jump – transports have been climbing steadily since April 2025.
Over the past year IYT beat the S&P 500 ETF (SPY) by four percentage points on a total‑return basis.
Technical Breakout Signals More Upside
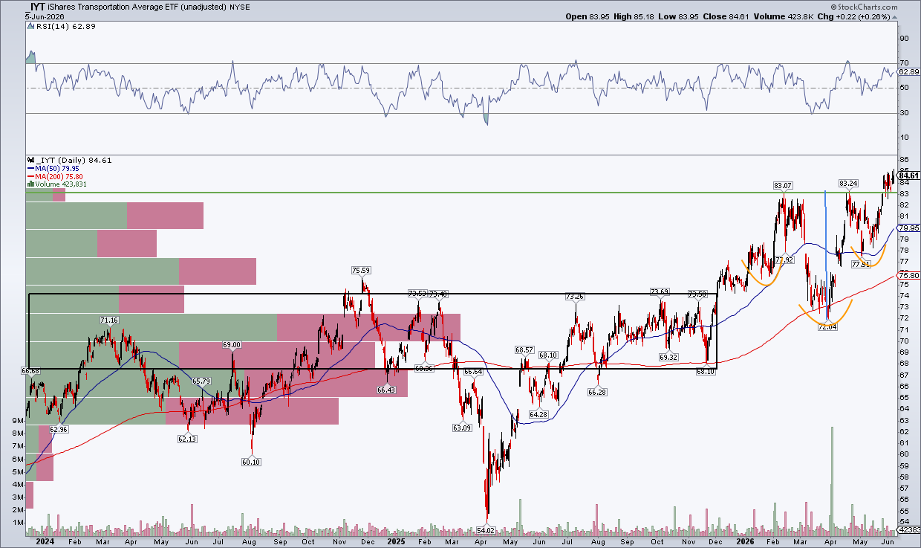
Looking at the chart, IYT is breaking above a "cup‑with‑handle" shape that also looks like an inverted head‑and‑shoulders. Both patterns point to more upside.
The price target from the pattern is about $95 – that’s the breakout level ($83‑$84) plus the measured move ($11+).
Long‑term moving averages are rising, and the 50‑day average sits above the 200‑day line, confirming a bullish bias.
The RSI indicator is not overbought, and it recently moved out of an oversold zone that started on March 30.
Long‑Term Support and Seasonal Boost
Long‑term support sits in the mid‑$70s, a zone that held a lot of trading volume. With the market looking clearer, IYT could keep climbing.
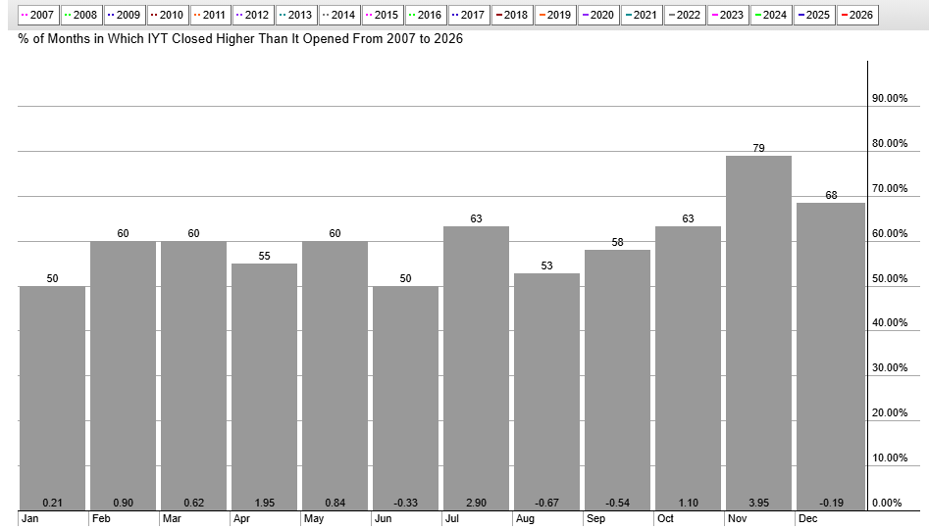
Historically June is a quiet month for transports, but July often brings strong gains, while August‑September can be choppy.
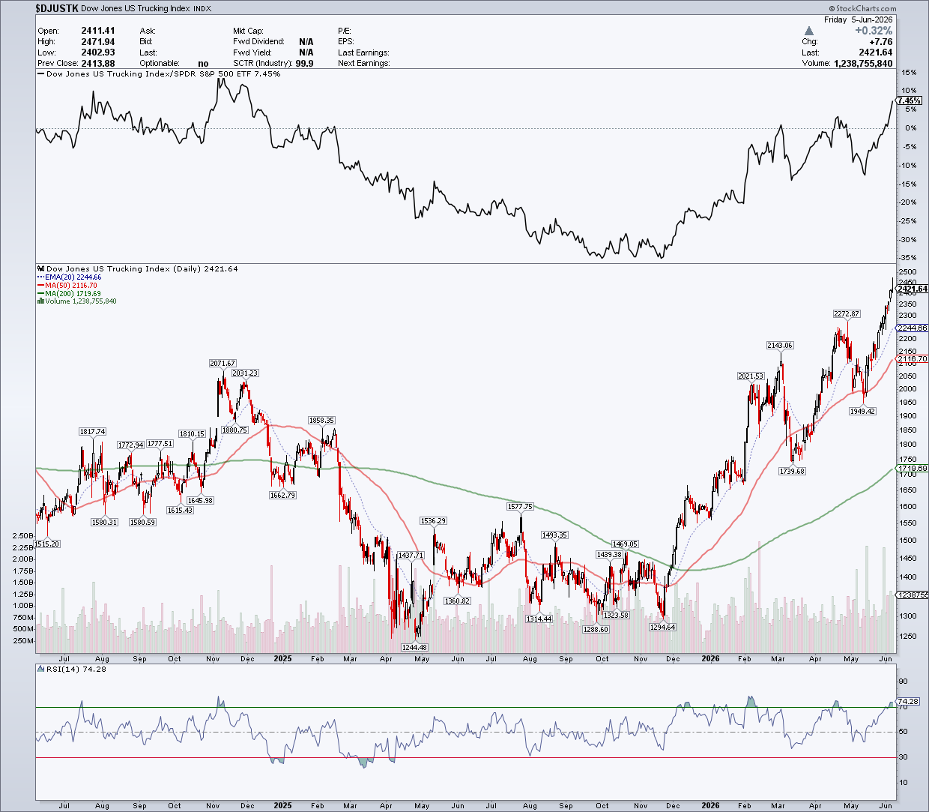
Trucking Leads the Market
If you dig deeper, the Dow Jones U.S. Trucking Index ($DJUSTK) is the top‑ranked industry by the SCTR score. It has risen on nine of the last ten trading days.
The index’s RSI stays in a bullish range (40‑80) and recently hit a record high despite a weak overall market.
Focus on Price, Not Headlines
Big macro news can be noisy. Watching price action gives clearer clues than following the day’s narrative.
Right now I am watching transport ETFs for two reasons: they may start a market rotation, and they show strong absolute and relative strength regardless of AI hype.
Bottom Line
Blue‑chip stocks held up last Friday despite a sell‑off in chips and the Nasdaq 100. Defensive areas like Utilities and Health Care were solid, but cyclicals such as transportation also showed strength.
This summer could belong to trucks, railroads and airlines.
Disclaimer: This article is for educational purposes only and does not constitute financial advice.
Source: Materials provided by https://articles.stockcharts.com.Note: Content may be edited for style and length.