

The market moved lower all week. Nifty swung inside a 582‑point range, reaching a high of 23,733.70 and a low of 23,151.50. It closed near the bottom of that range, dropping 181.05 points, or 0.77%.
Volatility stayed calm, with the India VIX falling 2.47% to 15.79. The index is now trading below its 50‑week and 100‑week moving averages but is holding above a crucial support band at 23,000‑23,100.
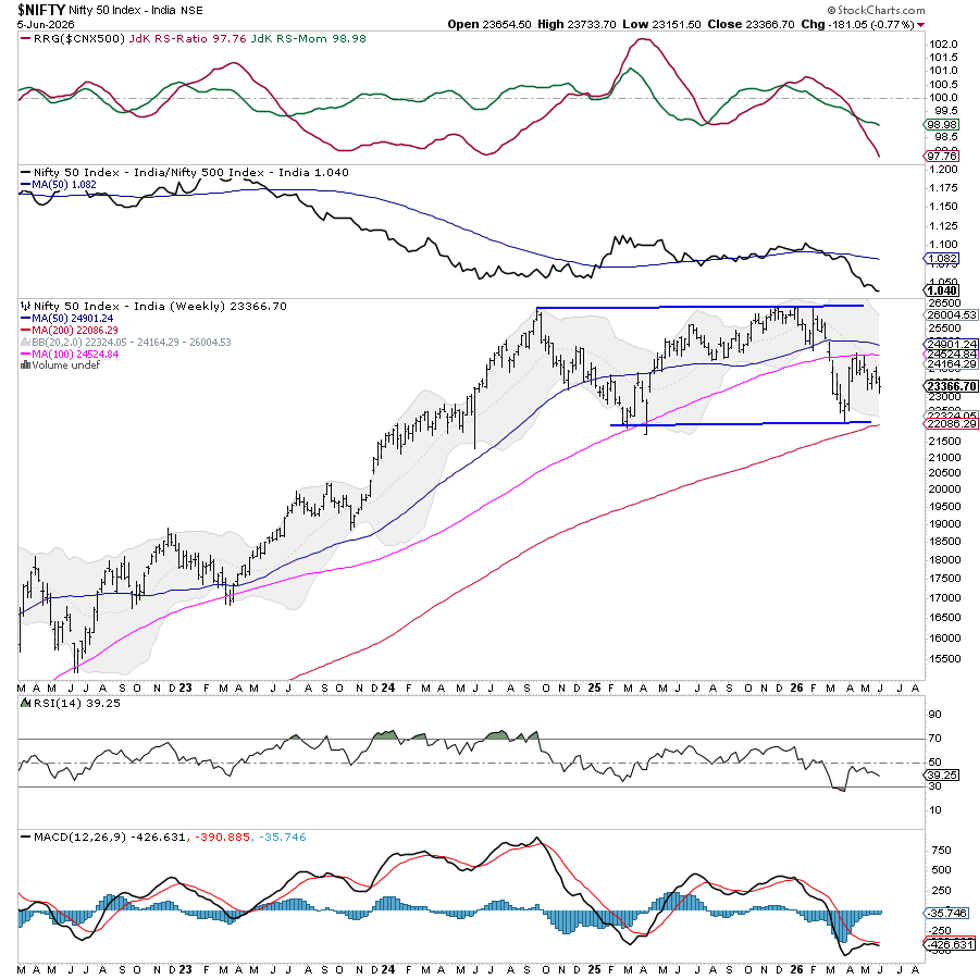
This support zone is acting like a safety net. Options data show that many traders are protecting this level. If the price breaks clearly below 23,000, the market could weaken further. To turn positive, Nifty needs to climb back above the 23,600–23,800 area.
Next week will probably start cautiously. Traders will watch how strong the 23,000–23,100 support stays. Key resistance levels are at 23,643 and 23,800, while support levels sit at 23,000 and 22,800.
The weekly Relative Strength Index (RSI) is 39.25, below the neutral 50 mark, indicating weak momentum. The MACD is also below its signal line, staying in negative territory.
Overall, Nifty is moving sideways inside a broad channel that has lasted several quarters. The recent drop has taken the index close to the lower edge of that channel, making the current price level technically important.
Long‑term trends are still intact because the 200‑week moving average at 22,087 offers strong support. However, the index remains under pressure, sitting below the 50‑week average (24,901) and the 100‑week average (24,526).
Traders should stay cautious. Wait for a clear break above the resistance zones or solid buying from the 23,000–23,100 support before taking aggressive positions. Focus on strong, individual stocks, manage risk, and protect capital, especially if the index slips under 23,000.
Sector Outlook for the Coming Week
We compared many sectors to the CNX500 (NIFTY 500) using Relative Rotation Graphs (RRG). The CNX500 represents over 95% of the market’s free‑float value.
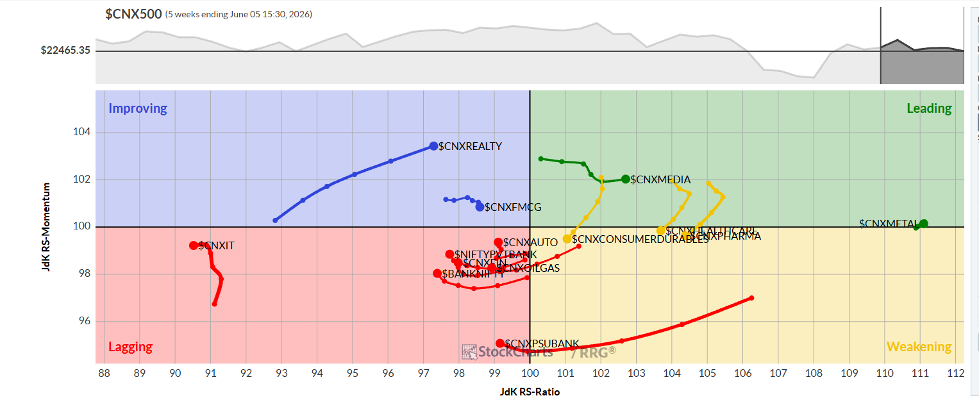
In the RRG, the Nifty MIDCAP100, Energy, Media, and Metal indexes sit in the leading quadrant. Those groups are likely to beat the broader market.
The Pharma, PSE, and Infrastructure indexes are in the weakening quadrant, meaning their relative performance may slow down.
The PSU Bank, Services, IT, Financial Services, and Nifty Bank indexes are in the lagging quadrant, suggesting they could underperform. The Auto index is also lagging, but its momentum is starting to improve.
Realty and the FMCG indexes are in the improving quadrant, although FMCG’s momentum appears to be fading.
Note: RRG charts show relative strength and momentum compared to the NIFTY500. They are not direct buy or sell signals.
Source: Materials provided by https://articles.stockcharts.com.Note: Content may be edited for style and length.