
First, a quick note…
Do you see the thin bar chart under the price chart? It tells a lot about who is buying and selling. To get the most out of it, rotate the bars so they line up with price. This turns a simple volume histogram into a powerful Volume‑by‑Price tool.
What Changes When Volume Is Aligned With Price?
The most common use of Volume‑by‑Price is to look at the longest bars. Those bars often sit where price has found strong support or resistance because many trades happened there.
But you can also read the bars as zones where the market either accepts or rejects price:
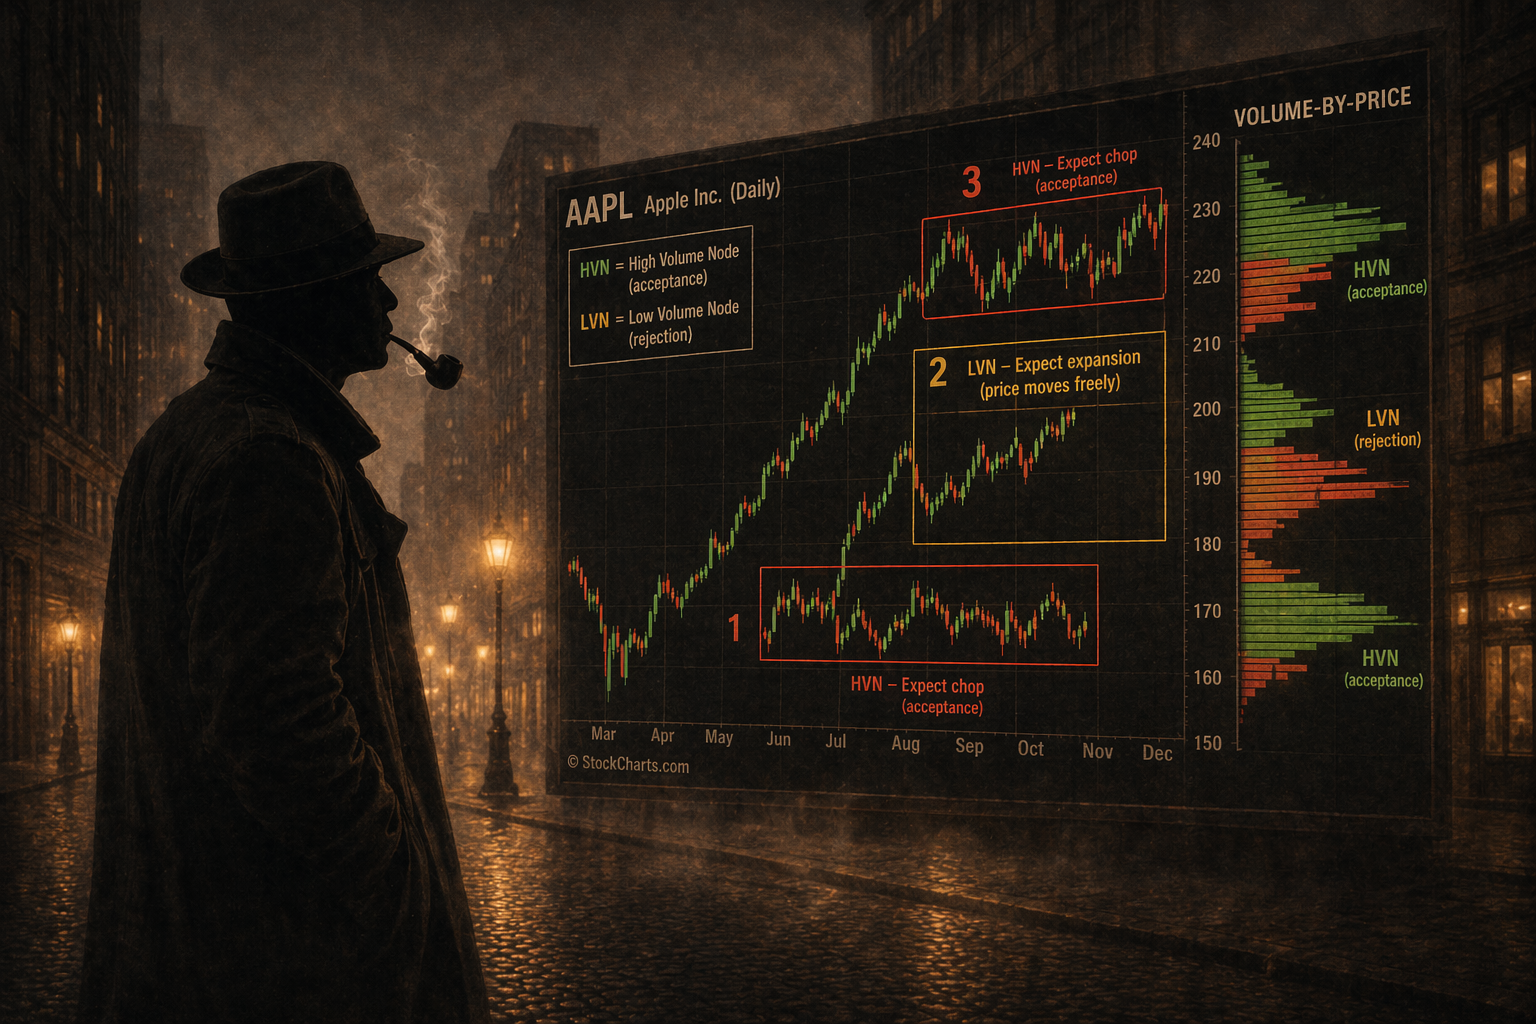
- High Volume Nodes (HVNs) – places where price is accepted.
- Low Volume Nodes (LVNs) – places where price is rejected.
This idea comes from J. Steidlmayer’s Volume Profile, but it works a bit differently with Volume‑by‑Price. Instead of asking “Where is support?”, ask “Where will price slow down or speed up?”
Insider Tip #1: Watch Trader Behavior, Not Just Levels
When price moves inside an HVN, especially when several HVNs sit next to each other, you often see a back‑and‑forth “traffic‑jam” pattern. Traders are trying to agree on a fair price. If the price finally breaks out, the move can be very strong.
Between HVNs, where LVNs sit, price usually travels faster and more freely. Expect quick moves and clear trends.
Look at the Apple chart above. The price bounces between two HVNs (marked 1 and 3). Those zones act like a contested hallway where buyers and sellers meet.
When the price moves through an LVN (the box labeled 2), it travels quickly from the August breakout to the mid‑October resistance. If price returns to that LVN, it may fall fast because little trading happened there.
- HVN = traffic jam (pressure can build for a breakout).
- LVN = open road (price can move with little resistance).
Key idea: Focus on how price behaves, not just where the bars sit.
Insider Tip #2: A Quick Breakout Filter
Not every breakout will keep going. Volume‑by‑Price can help you guess which ones might succeed.
Imagine two breakouts: one runs into a thick HVN field, the other heads into a thin LVN pocket. The first is likely to stall, while the second has room to run unless another obstacle appears.
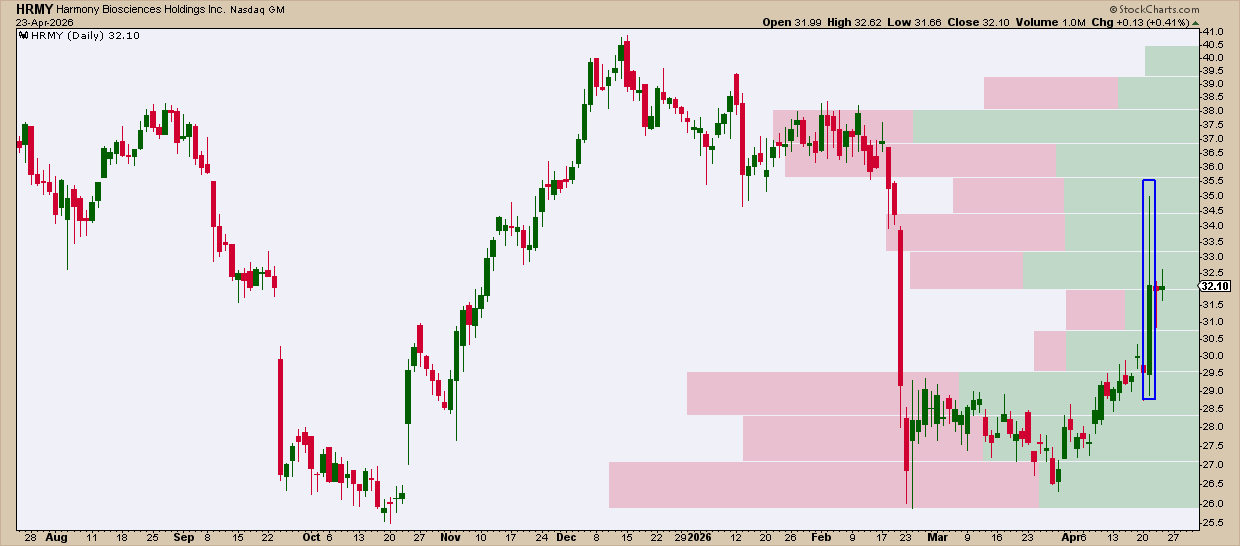
In the Harmony chart, a strong price drop appears inside a blue rectangle that lines up with a dense HVN cluster. The price likely hit resistance created by that heavy‑volume zone.
Before you chase a breakout, glance at the Volume‑by‑Price on the right side of the chart. If there’s “air” (low volume) above the price, the move may have room to breathe.
Insider Tip #3: See If Price Is Gaining Acceptance
Volume‑by‑Price tells you where the market has already agreed on value, but it doesn’t show acceptance in real time. Instead, watch how price behaves after it leaves a known HVN.
- If price jumps above an HVN, clears a recent swing high, and stays there, new value is forming.
- If price breaks a resistance level but then falls back into the previous HVN, the move lacks acceptance.
- If price drops below a key low and stays low, a new acceptance zone may be forming below.
- If price leaves an HVN but fails to hold above (or below) key levels, expect it to drift back toward the old value area.
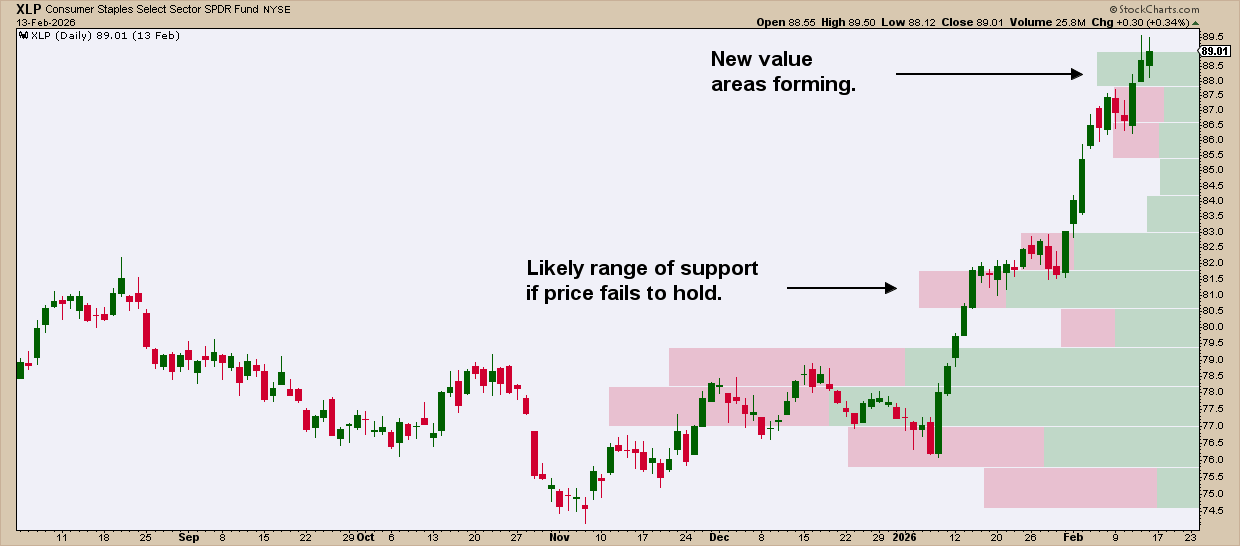
The Consumer Staples Select Sector SPDR Fund (XLP) showed a new high‑volume area forming. If price can’t stay above it, the next lower HVN could become the nearest support.
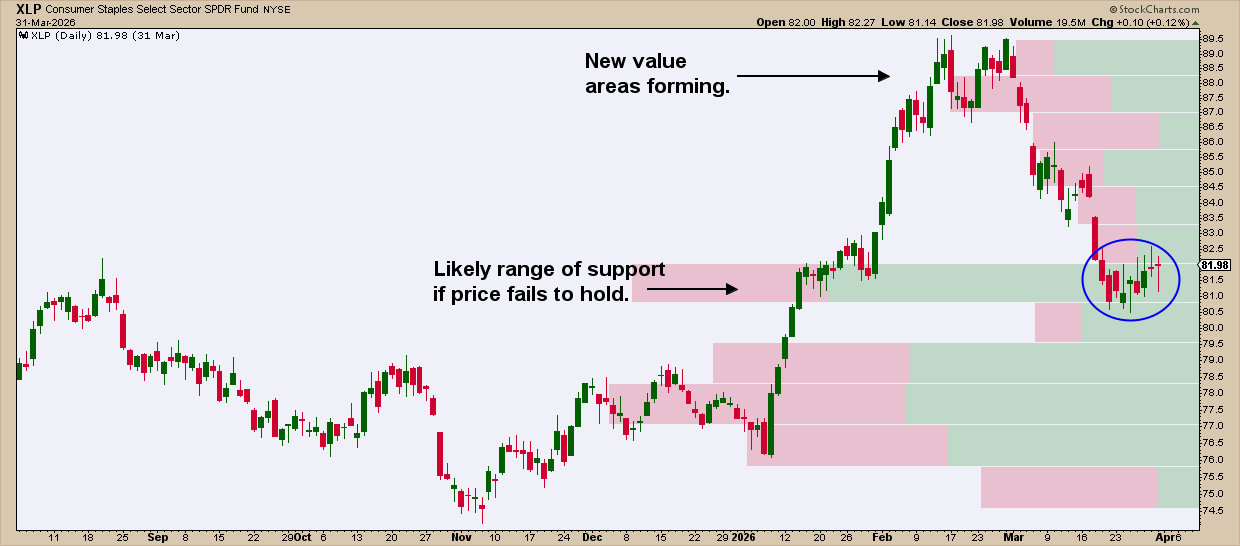
The main takeaway is to watch price action around old value zones while new zones are forming.
That’s All for Now
Using Volume‑by‑Price to draw support and resistance is a good start, but the real power lies in reading how price moves around those zones. HVNs tell you where traders have agreed on price; LVNs show where they haven’t. This helps you guess when price will pause, turn, or speed up.
Remember, Volume‑by‑Price is not a laser‑precise tool like a full Volume Profile, but it still highlights where most trading happened and where it didn’t.
Bottom line: When you can see where value sits and where it shifts, you’re already a step ahead of the crowd.
Source: Materials provided by https://articles.stockcharts.com.Note: Content may be edited for style and length.