
A fresh Fed chair, a U.S.–Iran agreement, and a booming chip sector made last week feel like a roller‑coaster. Here’s what mattered most.
What We Covered
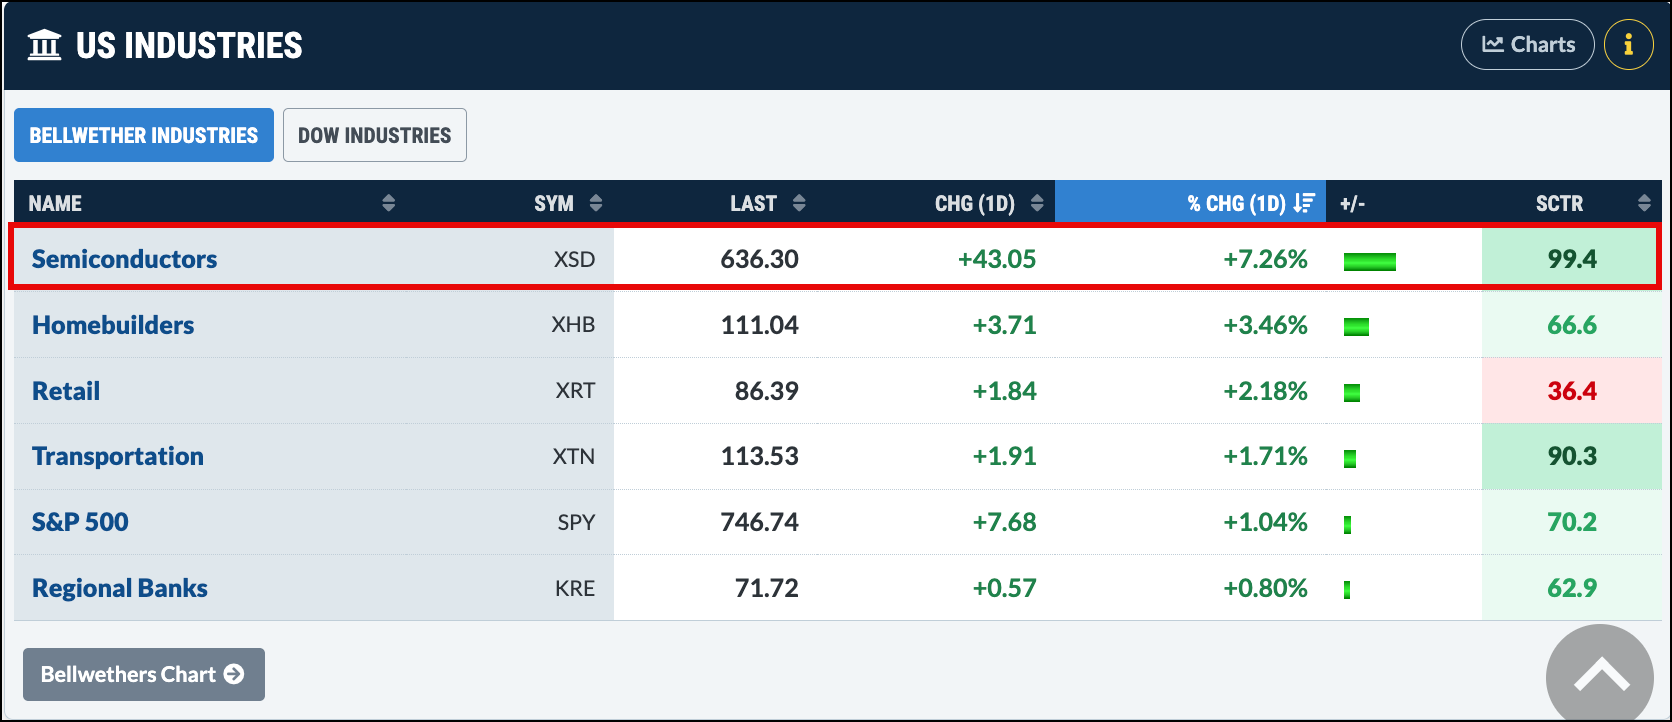
- Semiconductors lead the market
- New chart indicators and overlays
- Upcoming live webcast
When I checked the market summary after Thursday’s close, the semiconductor sector stood out. The index rose more than 7%, a move hard to miss.
The SPDR S&P Semiconductor ETF (XSD) shows a clear uptrend. Its price is beating the S&P 500 ETF (SPY), and the Relative Strength Index sits between neutral and overbought. That pattern hints the rally may keep going.
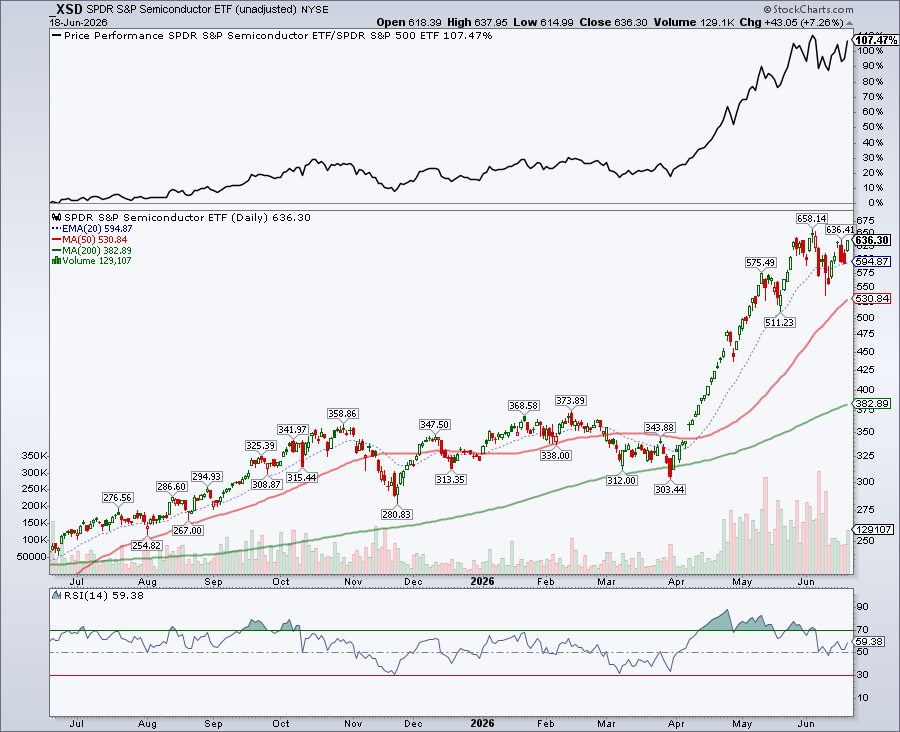
After a quiet winter, the chip sector woke up in April and has been climbing ever since. A 2% gain would push XSD to its 52‑week high, and it already outperformed the S&P 500 by more than 130%. If the momentum stays, the chip rally could last a long time.
New Chart Tools for Everyone
We have added several technical indicators and overlays to SharpCharts. They were once hidden in a premium tool, but now every user can try them.
Examples include the Alligator, Distance to Highs, and Performance Spread. More options are waiting in the Overlays and Indicators menus. Give them a spin – one might become part of your daily routine or simply offer a fresh view.
Live Webcast This Week
Dave Keller, CMT, will host a webcast that walks through a seven‑point checklist for spotting a market peak.
Topic: The Market Top Checklist – 7 Red Flags of a Major Market Peak
Date: Wednesday, June 24, 2026, 1:00 PM ET
Reserve your seat now and learn how to catch the next big market move.
Enjoy the long weekend and Happy Father’s Day!
Source: Materials provided by https://articles.stockcharts.com.Note: Content may be edited for style and length.