

The market moved up a little during the week. Buyers came in at lower prices and pushed the Nifty index up. It bounced between about 24,450 and 24,800, finishing near the top of that band. The India VIX, a measure of fear, fell almost 12 % to 12.97, showing that traders felt more comfortable. Overall, the index added 390 points, or about 1.65 %.
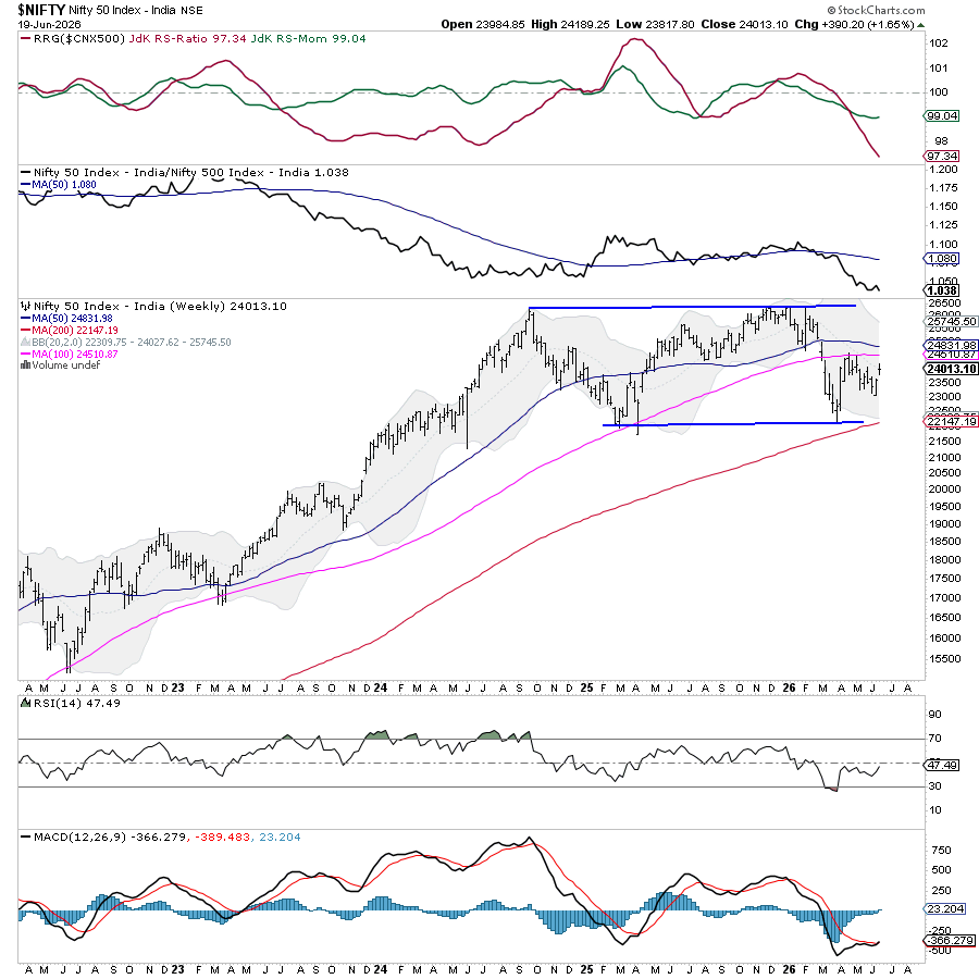
Looking at the charts, Nifty is stuck inside a wide trading band that has lasted several weeks. It is still below the 20‑week average (24,027) and also under the 50‑ and 100‑week averages (24,832 and 24,511). This keeps the medium‑term outlook neutral.
The zone from 24,500 to 24,850 acts like a wall of supply because many moving averages sit there. If the index can break above this wall, it may open the door for a stronger rally.
Next week will be only four trading days because of the Muharram holiday. Expect the market to start calmly, with individual stocks moving more than the overall index. Immediate resistance is near 24,250 and 24,400, while support may appear around 23,850 and 23,700.
The weekly RSI is 47.5, just below the neutral 50 line, and shows no clear sign of turning. The MACD stays above its signal line, and the histogram is growing, hinting at a slight boost in upward momentum.
Overall, Nifty is trying to settle inside its long‑term range after a sharp correction. It defended the lower support near the 200‑week average (22,150) and kept a bullish shape over the long run. However, it still cannot climb back above the 20‑, 50‑ and 100‑week averages, leaving the market vulnerable to sideways moves.
Traders should stay cautious. The drop in volatility and the protection of key support levels are good signs, but the big resistance cluster above still looms. Look for stocks that show strength and improving momentum, and protect any profits. Avoid chasing big moves until Nifty clearly breaks through the 24,500‑24,850 band.
Sector Outlook for the Next Week
We used Relative Rotation Graphs (RRG) to compare sector performance against the NIFTY 500, which represents most of the market.
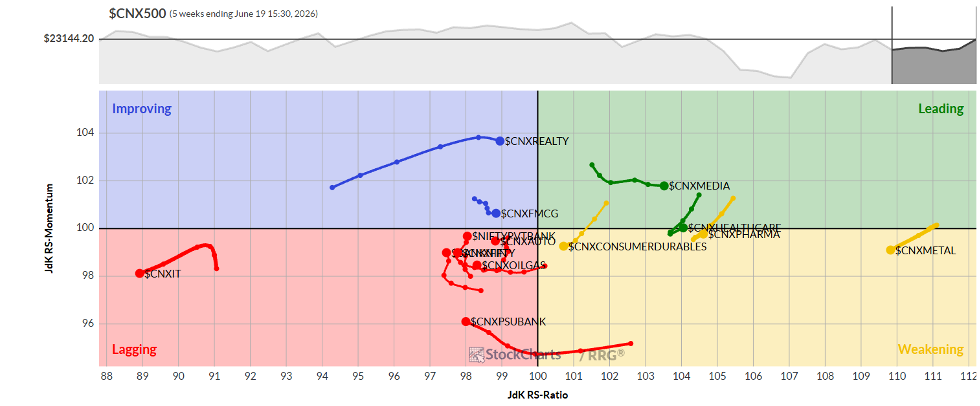
Media, Mid‑Cap 100 and Energy are the only sectors in the leading quadrant, meaning they could beat the broader market. Energy looks a bit weak, but the group still shows relative strength.
Metal and PSE indices are in the weakening quadrant, suggesting they may lag further. Pharma and Infrastructure are also weakening, though they show signs of improving momentum.
IT, Auto and Financial Services remain in the lagging quadrant, indicating they could underperform. Bank‑related indices are also lagging but are starting to gain some momentum.
Realty and FMCG are placed in the improving quadrant, hinting at a possible bounce.
Note: RRG charts only show relative strength and momentum. They are not direct buy or sell signals.
Source: Materials provided by https://articles.stockcharts.com.Note: Content may be edited for style and length.