
Quick Intro
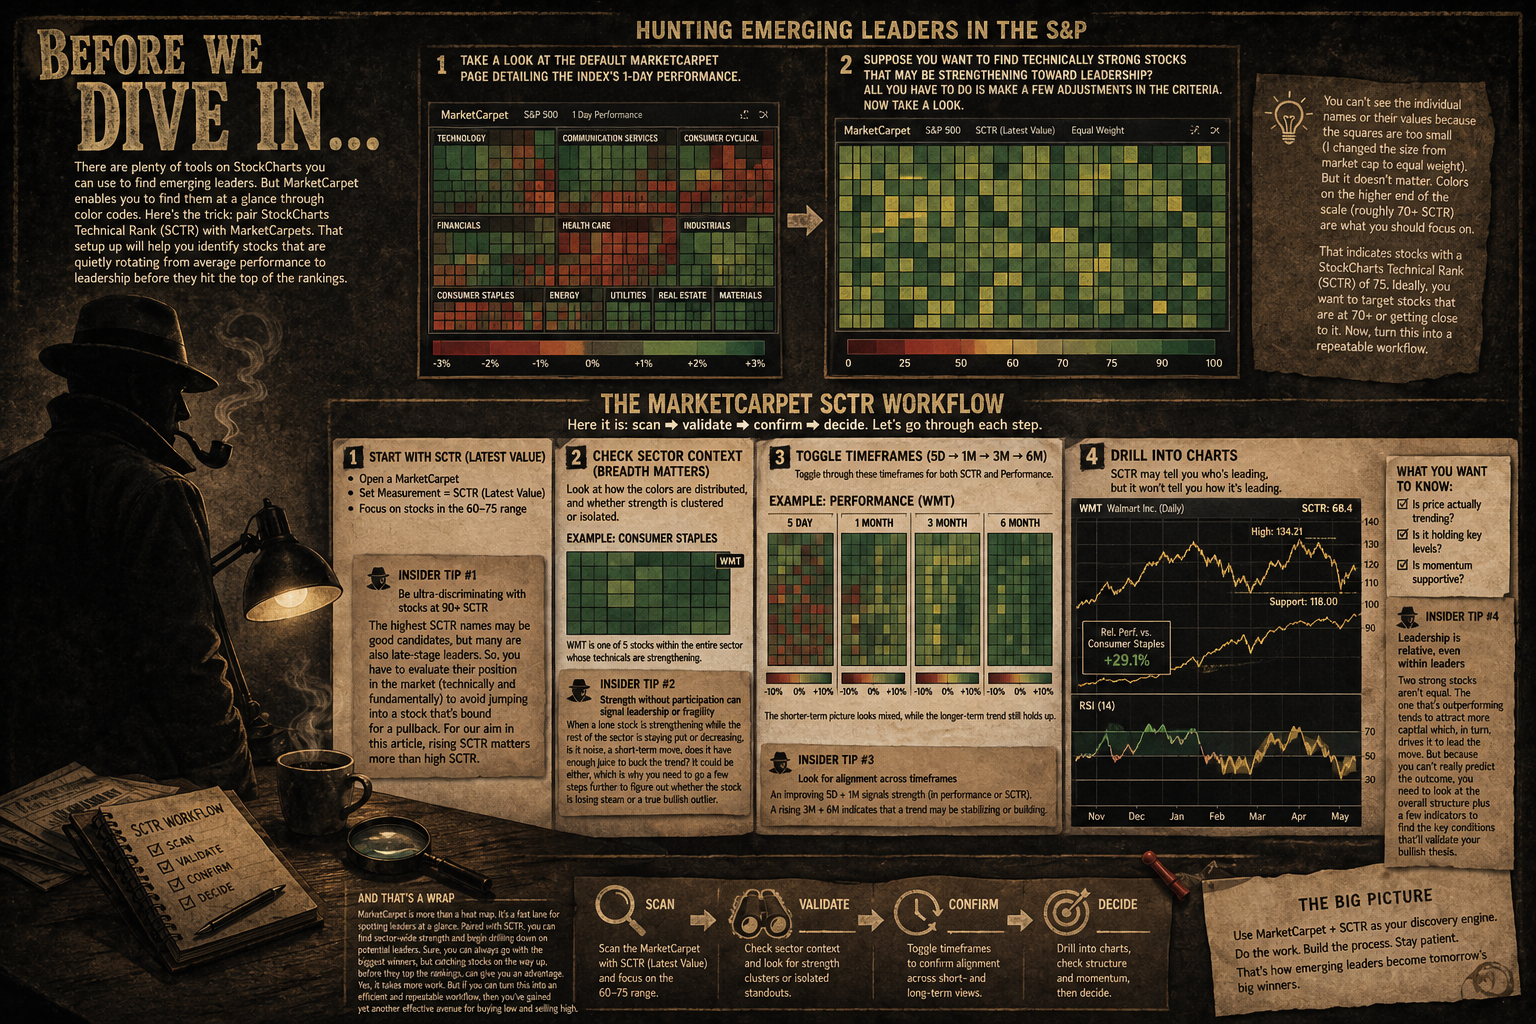
There are many tools that show rising stocks. One of them lets you see strength with colors. By pairing a technical rank score with a heat‑map, you can catch stocks that are climbing toward the top before they get there.
Finding New Leaders in the S&P
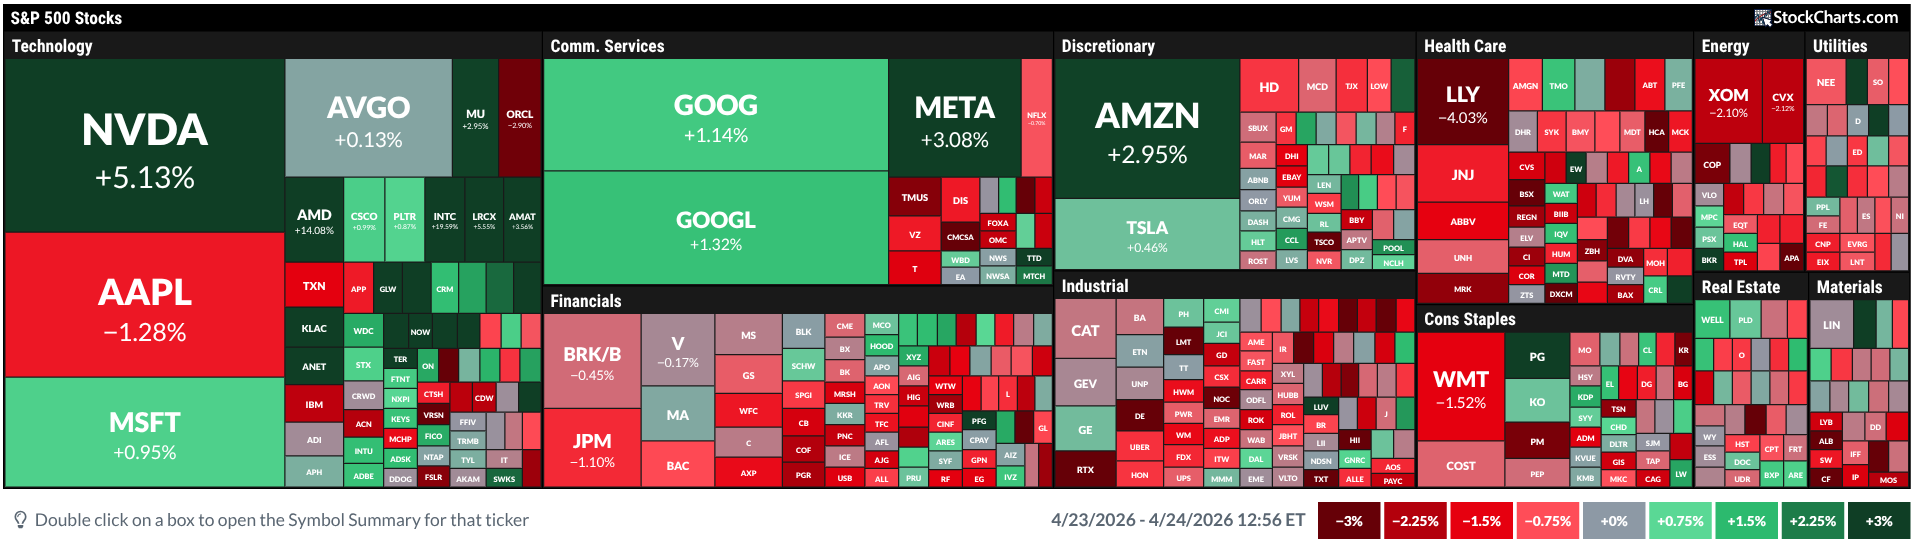
Open the default heat‑map that shows one‑day performance for the index.
Want to see technically strong stocks that may soon lead? Just change a few settings. See below.
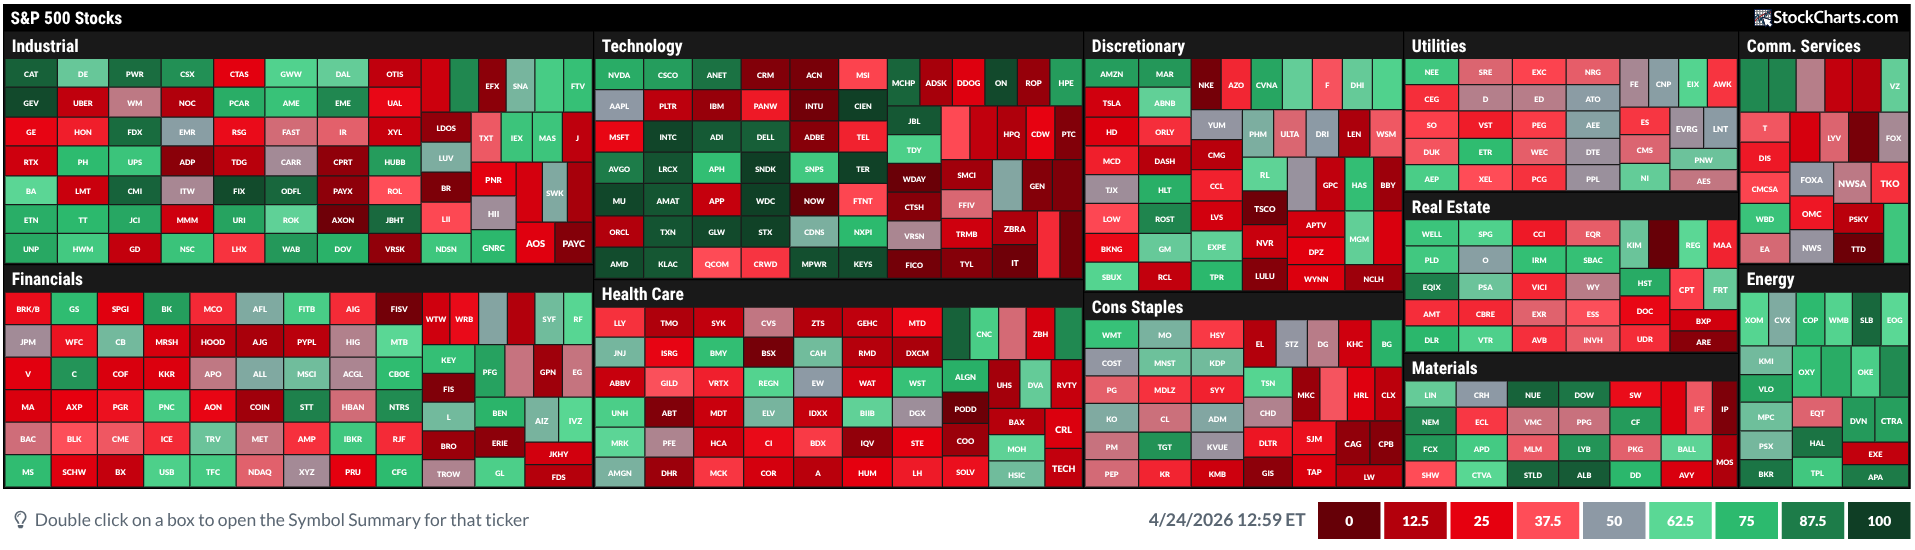
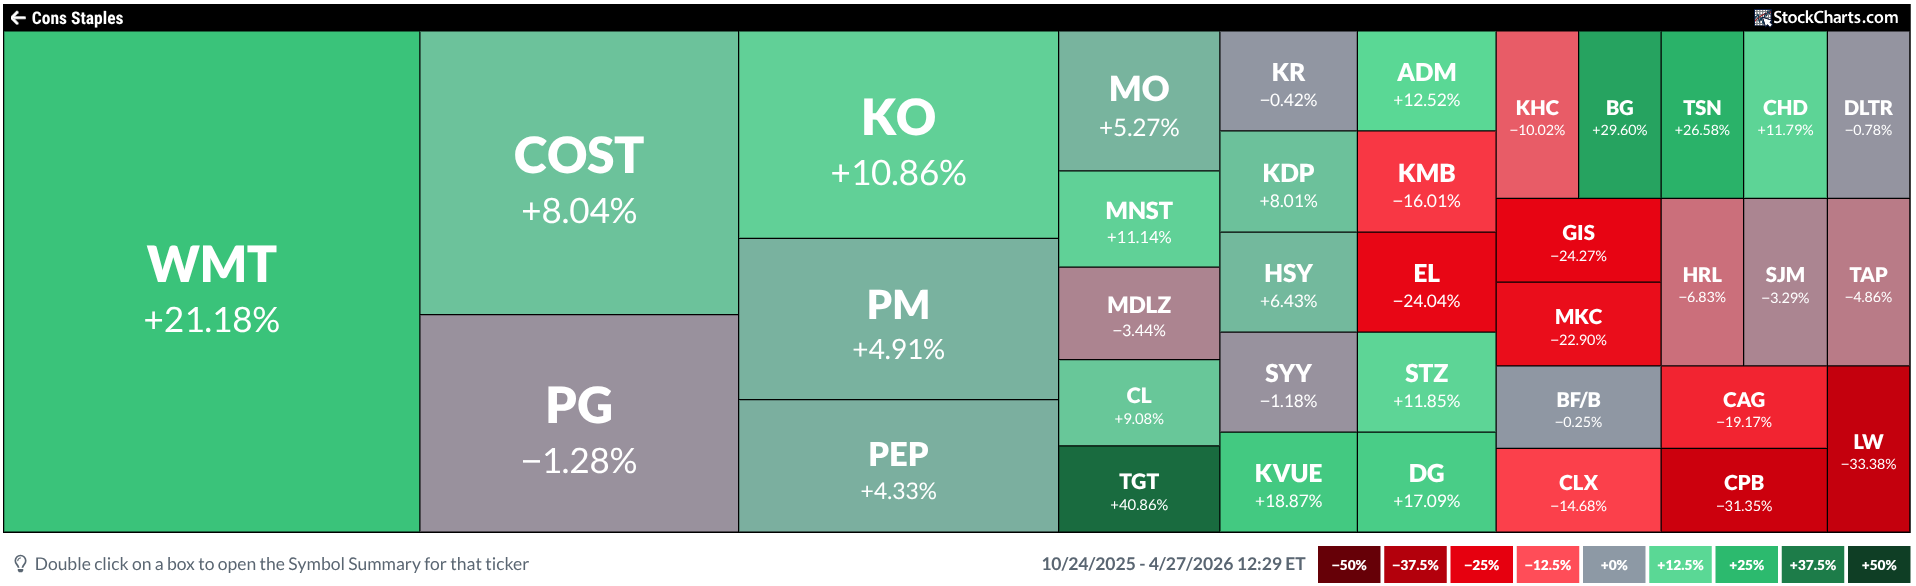
The squares are small, so you can’t read names directly. That’s okay. Look for the brightest colors – they usually mean a rank above 70.
A score of 75 is strong. Aim for stocks in the 70‑plus range or moving toward it. This can become a repeatable process.
The Simple Heat‑Map Workflow
Scan → Validate → Confirm → Decide
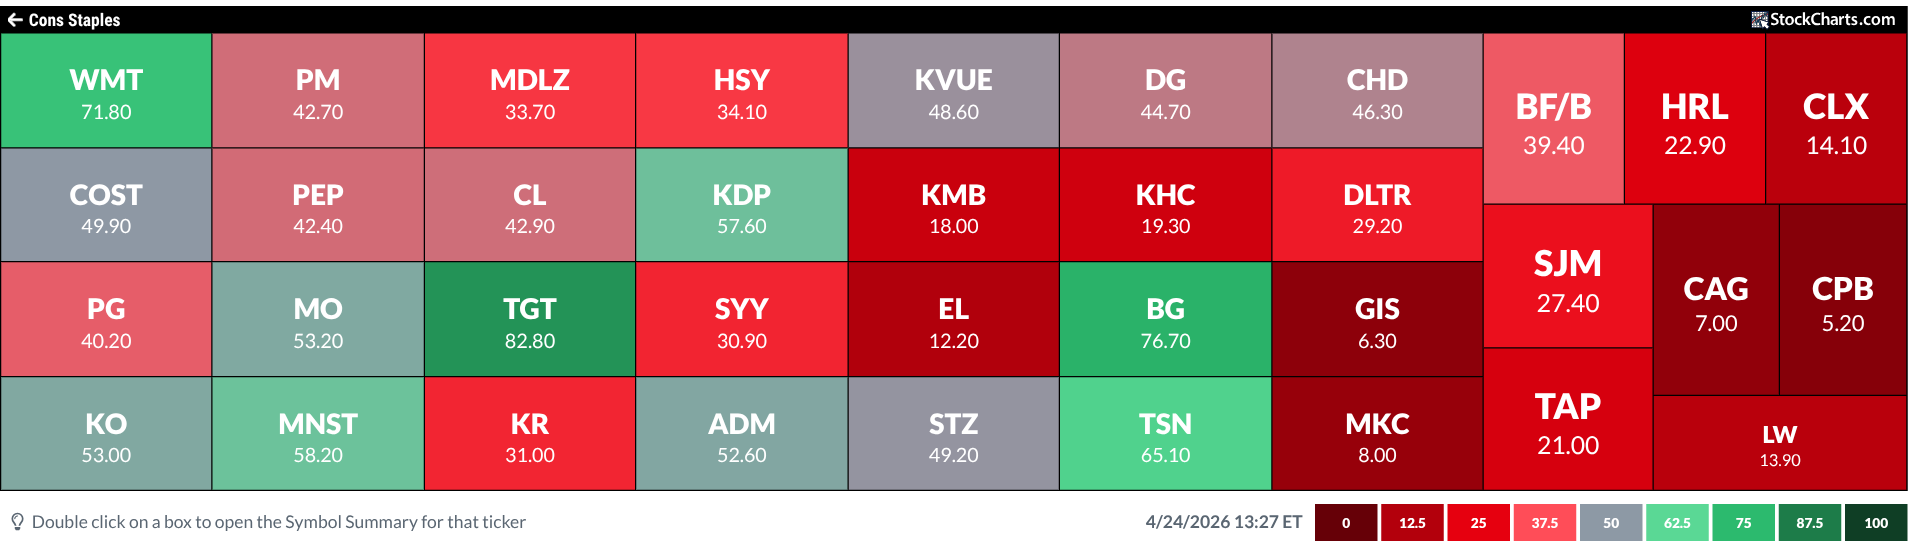
Step 1: Start with the Rank Score
- Open the heat‑map
- Set the measurement to the latest rank score
- Look at stocks scoring between 60 and 75
Scores above 75 put a stock in the top quarter of its group. The 60‑75 band often catches stocks that are moving up.
Tip: Be picky with scores above 90. Those are usually late‑stage leaders and may pull back soon.
Step 2: Check the Sector Context
Zoom out a bit. See how colors spread across the sector. Ask yourself:
- Is the strength isolated to one stock?
- Or is the whole sector green?
Example: In Consumer Staples, a bright square appears for a big retailer. That means only a few stocks in the sector are gaining strength.
Tip: A lone strong stock can be a leader or just noise. Look deeper to decide.
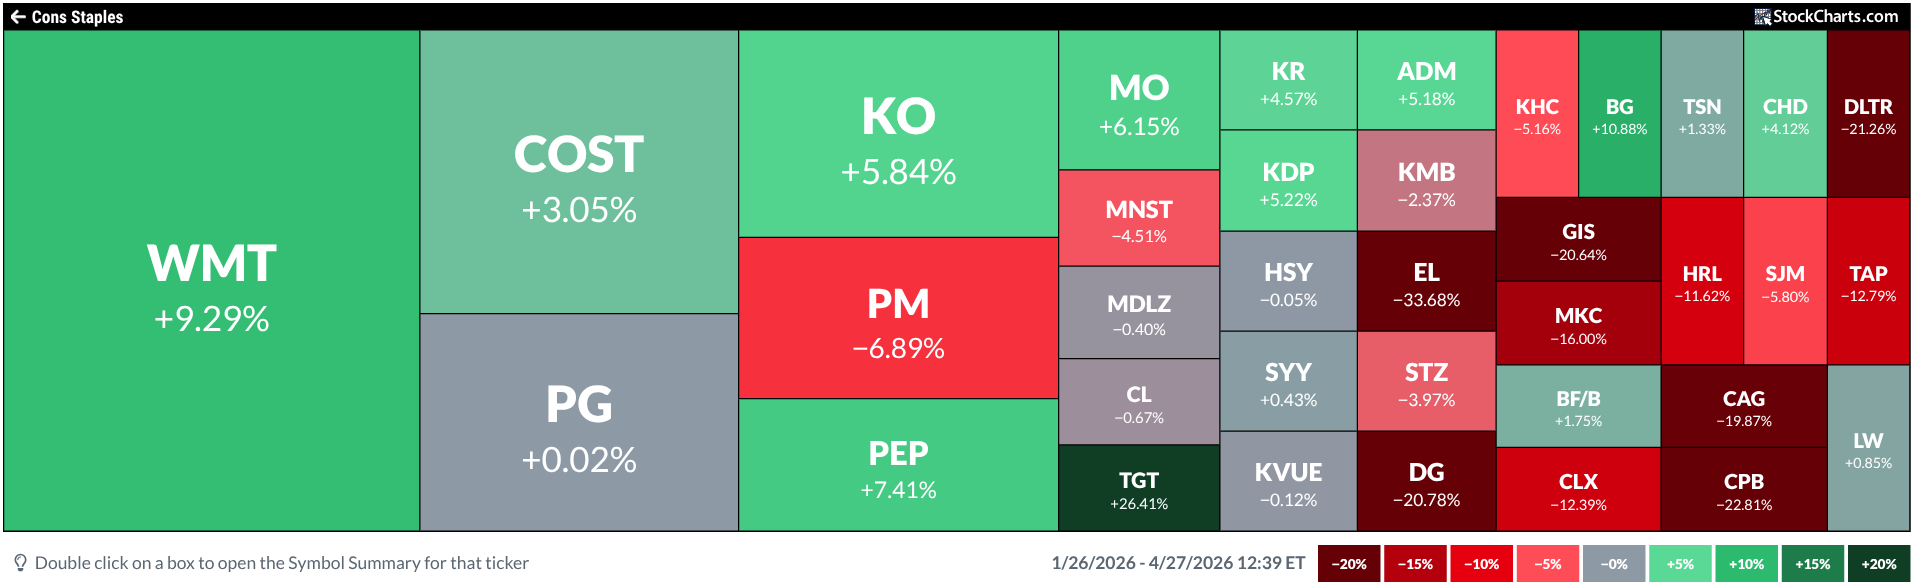
Step 3: Compare Different Timeframes
Switch the performance window to see short‑ and long‑term trends. A quick look at 5‑day, 1‑month, 3‑month, and 6‑month views helps you see if momentum is building.
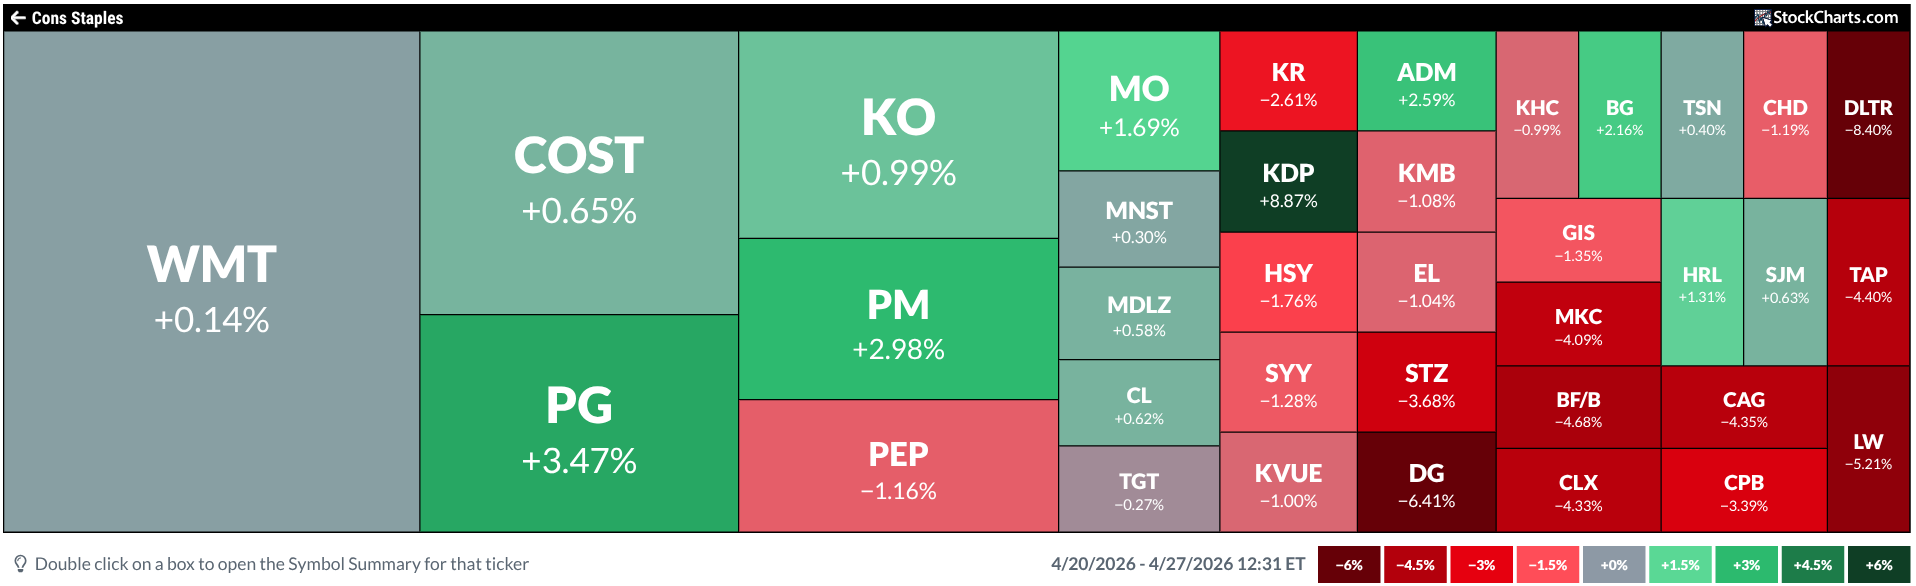
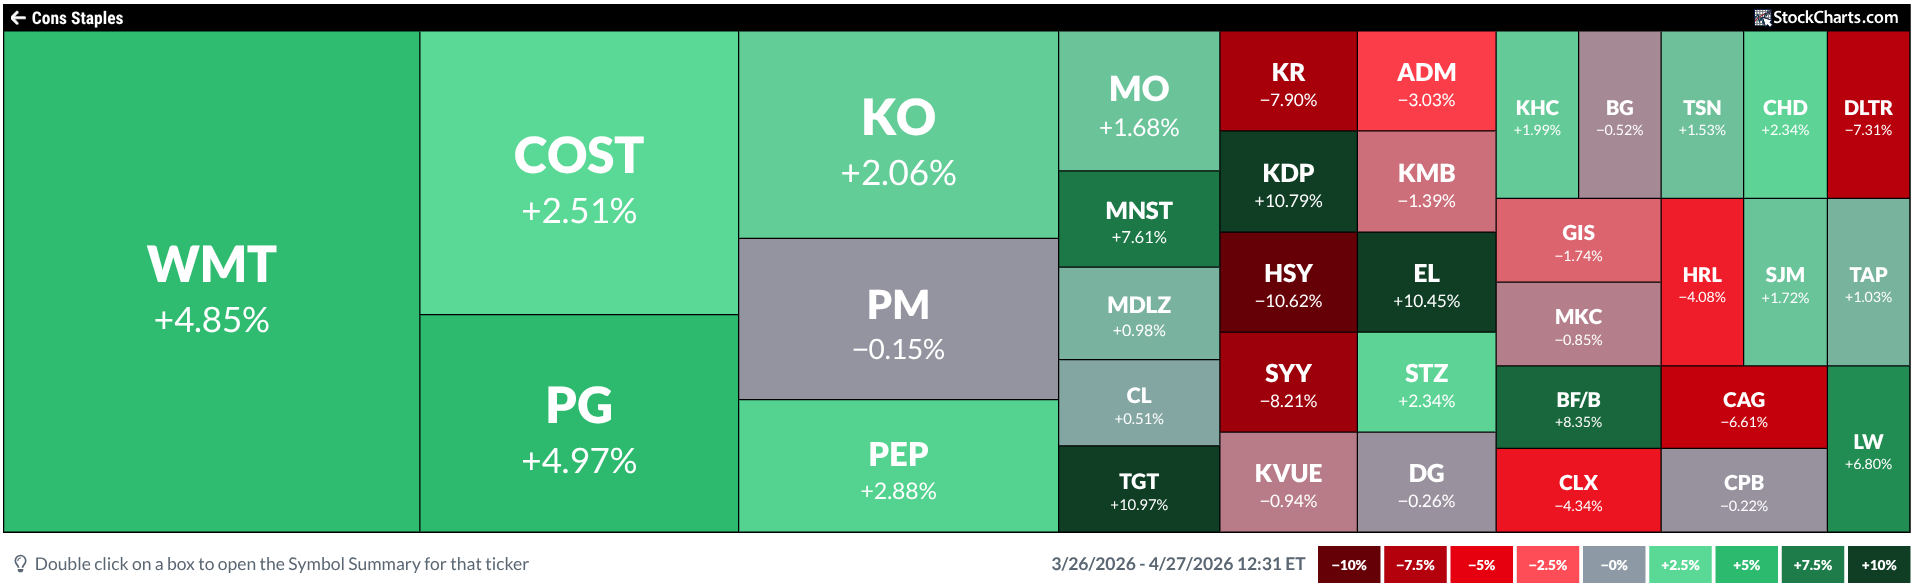
Tip: When short‑term and long‑term scores both improve, the stock’s strength is more reliable.
Step 4: Dive Into the Price Chart
Now look at the actual price chart. Ask:
- Is the price trending up?
- Is it holding important support levels?
- Does momentum back the move?
A high rank without a solid chart pattern can be risky.
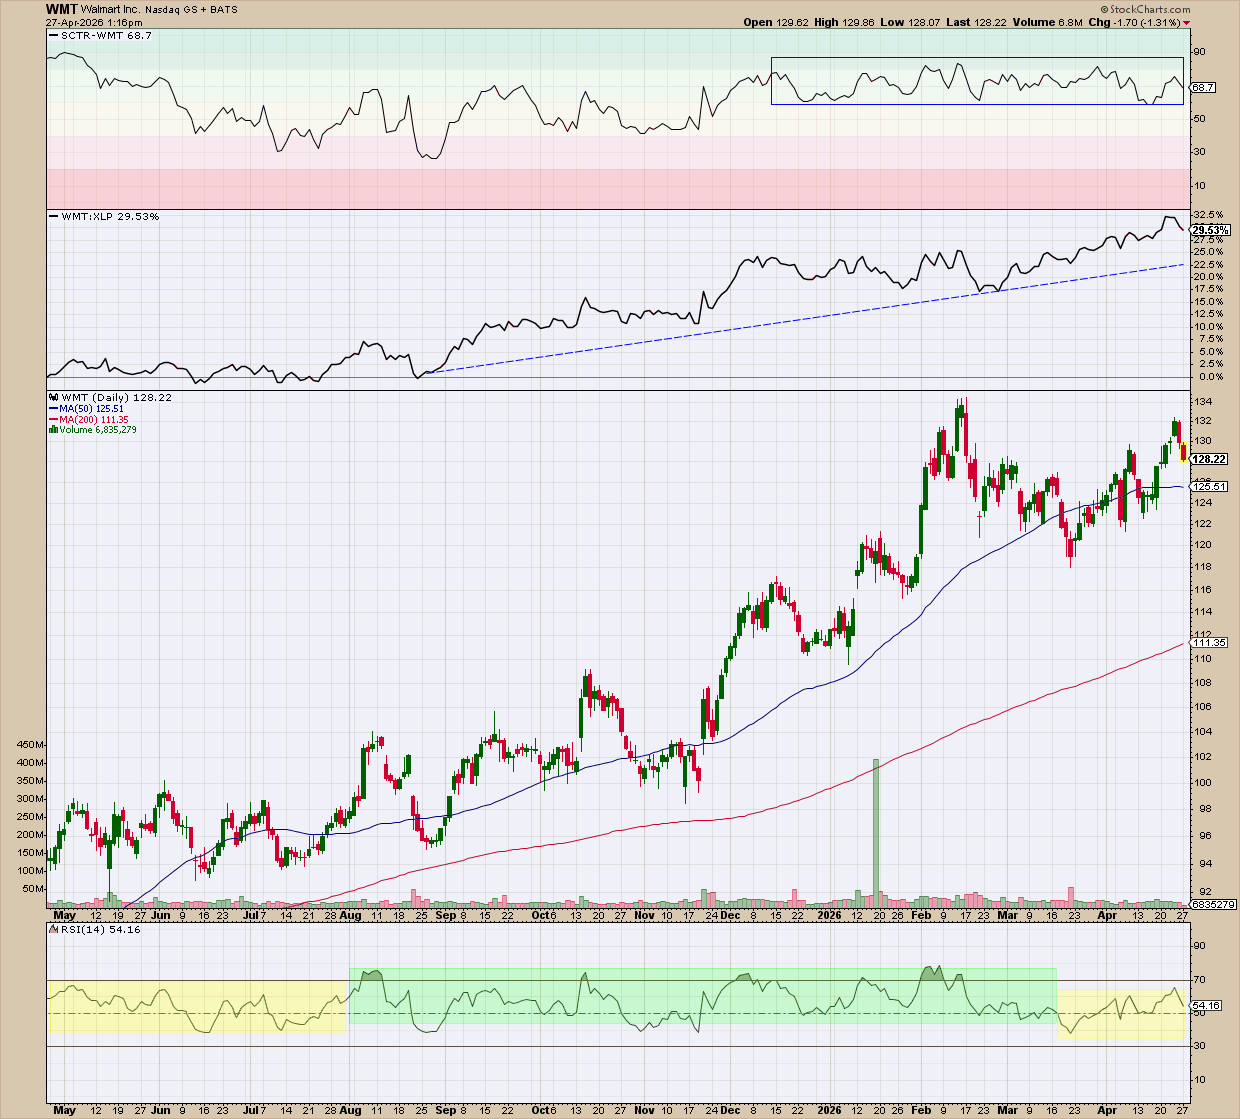
The chart shows the stock beating its sector by about 29%, but the rank stays in the 60‑80 zone. Price peaked, fell, and is now testing a lower level. Look at the RSI indicator: a range of 50‑70 suggests momentum could support a rise.
Tip: Two strong stocks are not equal. The one that’s pulling more capital usually becomes the true leader.
Wrap‑Up
Heat‑maps give a quick visual of sector strength. When you pair them with a rank score, you can spot stocks that are moving toward leadership. It takes a few extra clicks, but the workflow can become fast and repeatable. Use it to find stocks before they hit the top and gain an edge.
Source: Materials provided by https://articles.stockcharts.com.Note: Content may be edited for style and length.