

Before we start…
Gold has been in the news a lot since 2020. Before that, many thought it was an old and boring thing. Then inflation rose, debt grew, currencies looked shaky, and world politics got tense. Suddenly, gold became popular again. This shows how cycles can change.
Most investors ask if gold is cheap or expensive. Insiders think a little differently. They ask what gold can actually buy. They see gold as "sound money." The price tells one story, but the buying power tells another.
Don’t Look at Price, Look at Buying Power
If you only compare gold to the U.S. dollar, you miss the bigger picture. Where is the dollar heading?
From 1808 to 1912 gold stayed around $20 an ounce. By May 2026 it is close to $4,500. That means gold can buy many more dollars now. But does it also buy more of the things we need? That is what macro investors watch.
Housing‑to‑Gold Ratio
How many ounces of gold does it take to buy a typical house?
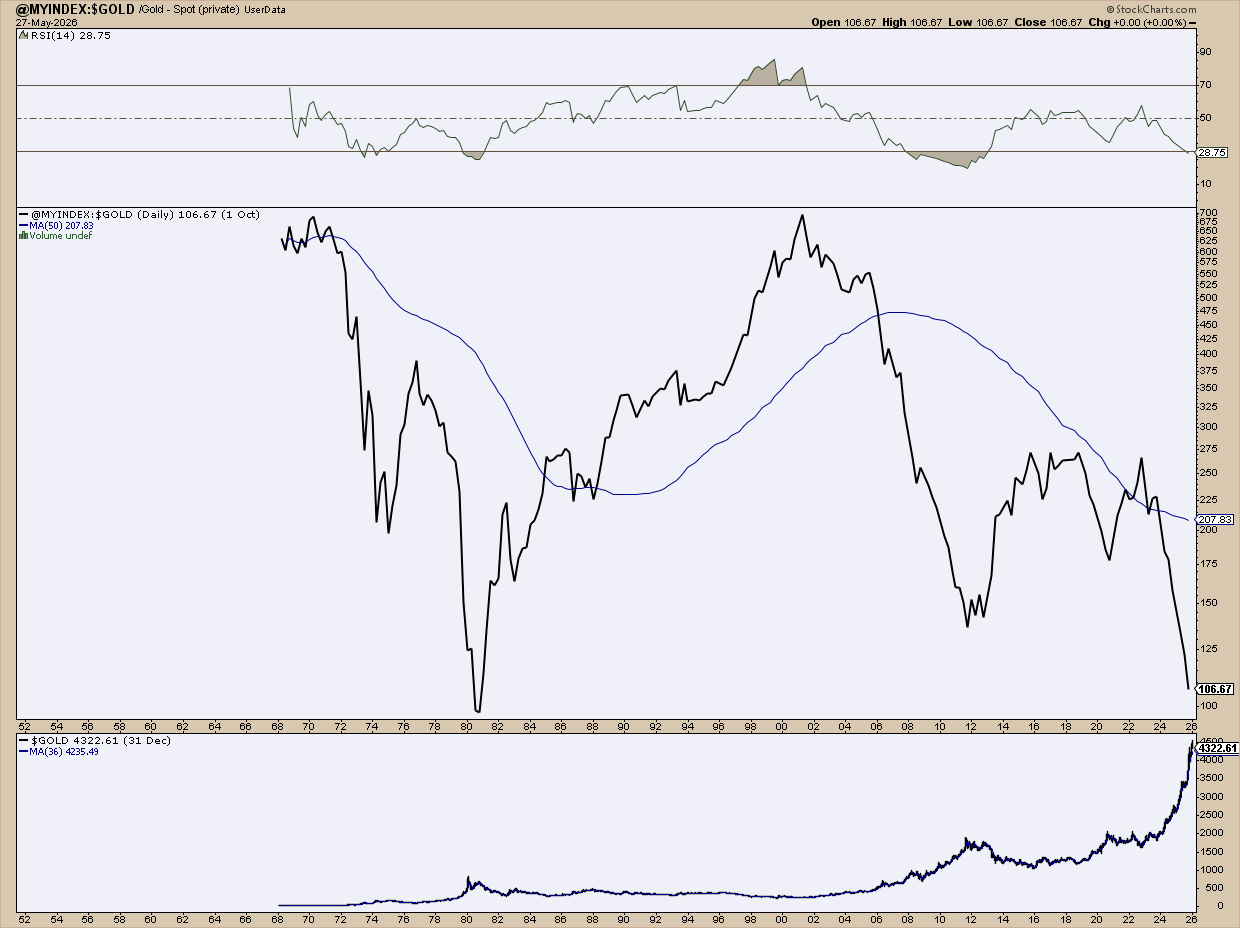
The chart uses data from the Federal Reserve (FRED) and StockCharts. Gold prices have gone up overall, but the ratio shows a different story.
When the ratio goes up, houses become more expensive in gold terms. When the ratio falls, gold can buy more houses.
In 1970 and 2001 it took about 700 ounces of gold to buy a median house. In 1980 and 2026 it was roughly 100 ounces. A high ratio suggests gold is cheap compared to housing, a low ratio suggests it may be pricey.
Dow‑to‑Gold Ratio
Most people track stocks with the S&P 500, but gold fans often compare gold to the Dow Jones Industrial Average.
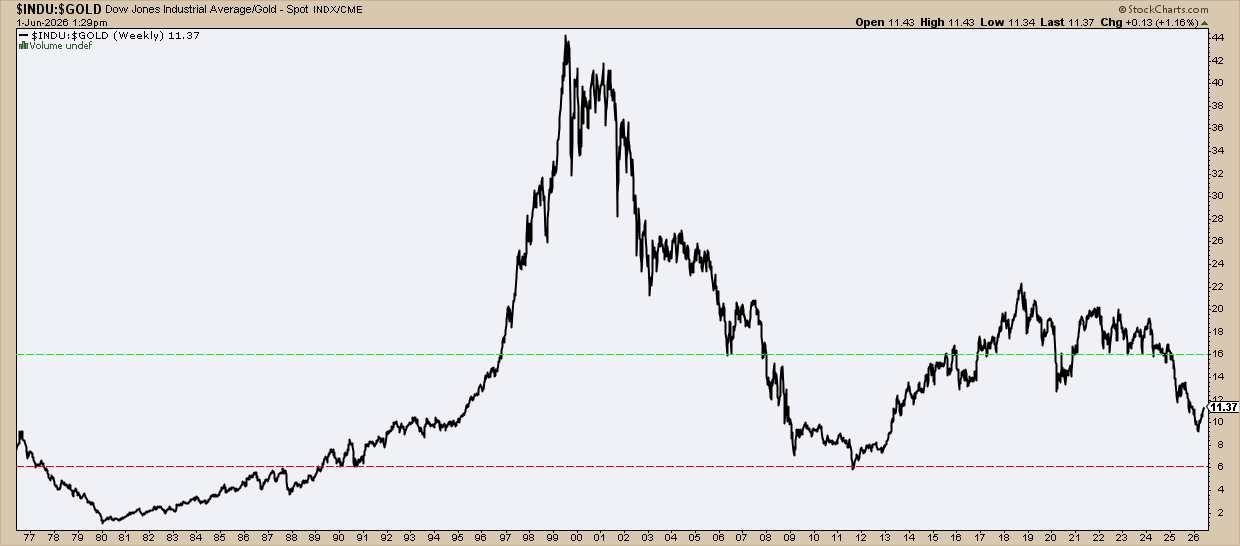
When the ratio is below 5, gold is very expensive compared to stocks. When it is above 15, gold is cheap and stocks feel pricey.
In 1980 the ratio was high, so buying a lot of gold then would not have been smart. Around 1999‑2000 the ratio fell, making gold a good buy at that time.
Gold‑to‑Silver Ratio
Silver is often called "the poor man’s gold" because it is both an industrial metal and a store of value.
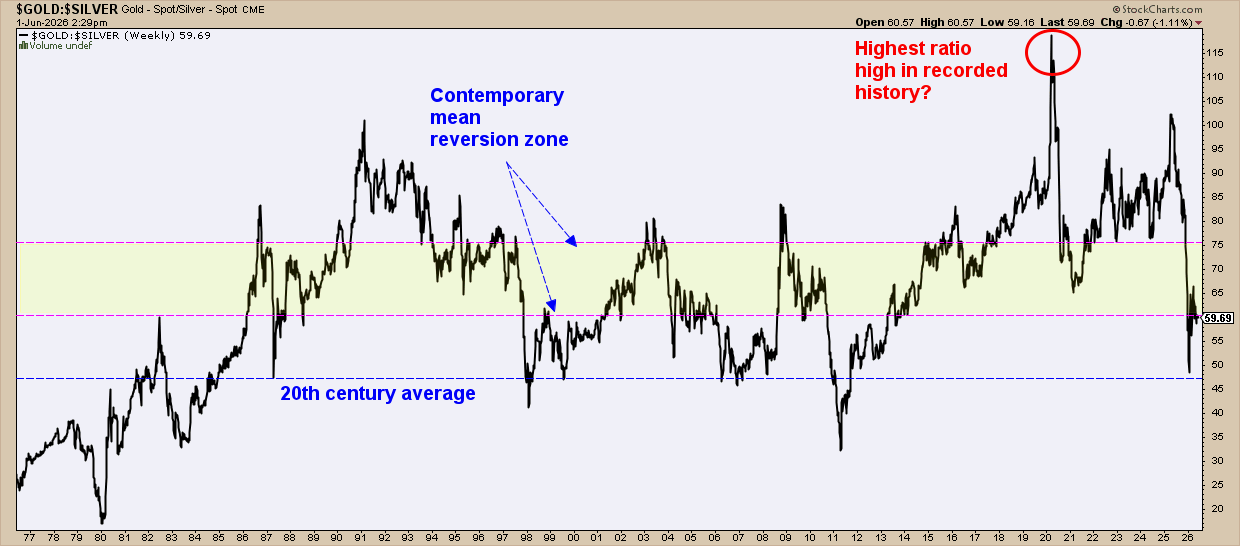
The ratio tells you how many ounces of silver you need for one ounce of gold. A classic number is 15 : 1, but the 20th‑century average is about 47 : 1. In recent years the ratio has moved between 60 and 75.
In 2020 the ratio spiked to around 120 : 1, a level not seen in recorded history. That was a clear sign that silver was very cheap compared to gold, and many investors bought more silver.
Wrap‑Up
Price shows what gold costs. Ratios show what gold can actually buy.
The housing ratio compares gold to a real‑world asset. The Dow‑to‑gold ratio compares it to the stock market. The gold‑to‑silver ratio points to where fear or opportunity may hide.
These ratios are not buy‑or‑sell signals on their own, but they give you a broader view that most stock investors don’t have. That broader view is the insider’s edge.
Source: Materials provided by https://articles.stockcharts.com.Note: Content may be edited for style and length.