


The technology sector is pulling the S&P 500 down as June ends. Other parts of the market are stepping in. Industrials, health‑care, finance and utilities are all moving higher. This shift also lifts the Regional Bank ETF and the Biotech SPDR, which have reached new highs.
Industrials, Health Care, Finance, and Utilities Fill the Gap
In June the tech ETF (XLK) fell about 3.4%, dragging the S&P 500 (SPY) and the Nasdaq (QQQ) down roughly 3% each. Tech makes up 37.5% of the S&P 500 and 67% of the Nasdaq, so its drop is felt strongly.
All of the other sector ETFs rose, showing that money is flowing into those areas. Health care (XLV), finance (XLF), industrials (XLI) and utilities (XLU) led the gains. Within health care, the biotech ETF (IBB) rose more than 6% and the Biotech SPDR (XBI) was the biggest winner with an 11% jump.
In finance, the Regional Bank ETF (KRE) and the Bank SPDR (KBE) each climbed over 7% month‑to‑date. The aerospace and defense ETF (ITA) added about 0.8%.
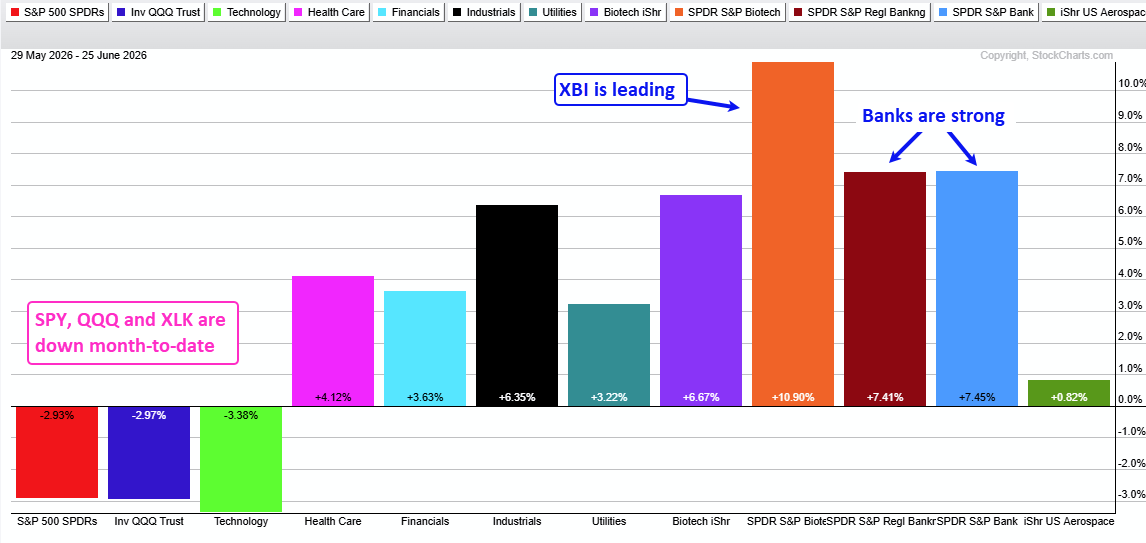
Banks and Biotech Lead the Gains
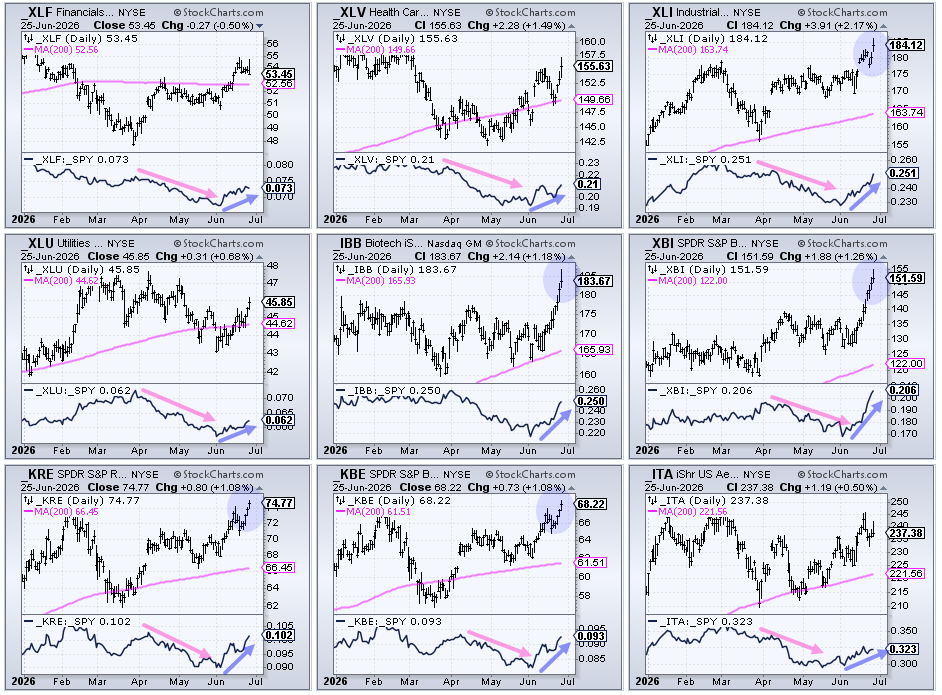
Charts that show price‑relative performance compare each ETF to the S&P 500. When the line goes up, the ETF is beating the market; when it goes down, it is lagging.
All nine ETFs are trading above their 200‑day moving averages, a sign of strength. Industrials, biotech and banks have all made new highs this month, confirming them as the true leaders.
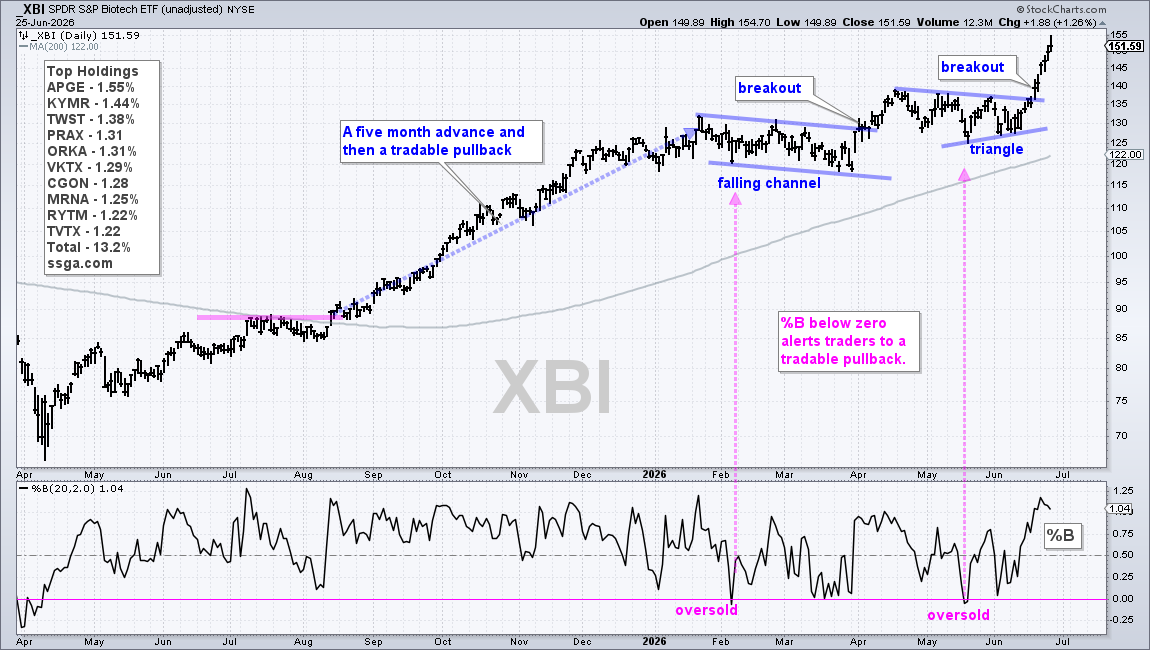
Biotech ETF Breaks Out of a Bullish Consolidation
Pullbacks and side‑ways moves can be good entry points when the overall trend is up. The Biotech SPDR (XBI) entered a long‑term uptrend after breaking above its 200‑day average in August. It fell in a channel through April, giving a clear pullback, then broke out in early April and set a new high.
From mid‑April to mid‑June the price formed a triangle shape. When the triangle broke on June 17, XBI surged to fresh highs. A triangle inside an uptrend is a bullish continuation pattern.
The Bollinger Band %B indicator fell below zero in early February and again in mid‑May, signaling short‑term oversold conditions. These moments alert traders to watch the chart for a possible bounce.
How to Add to a Winning Position
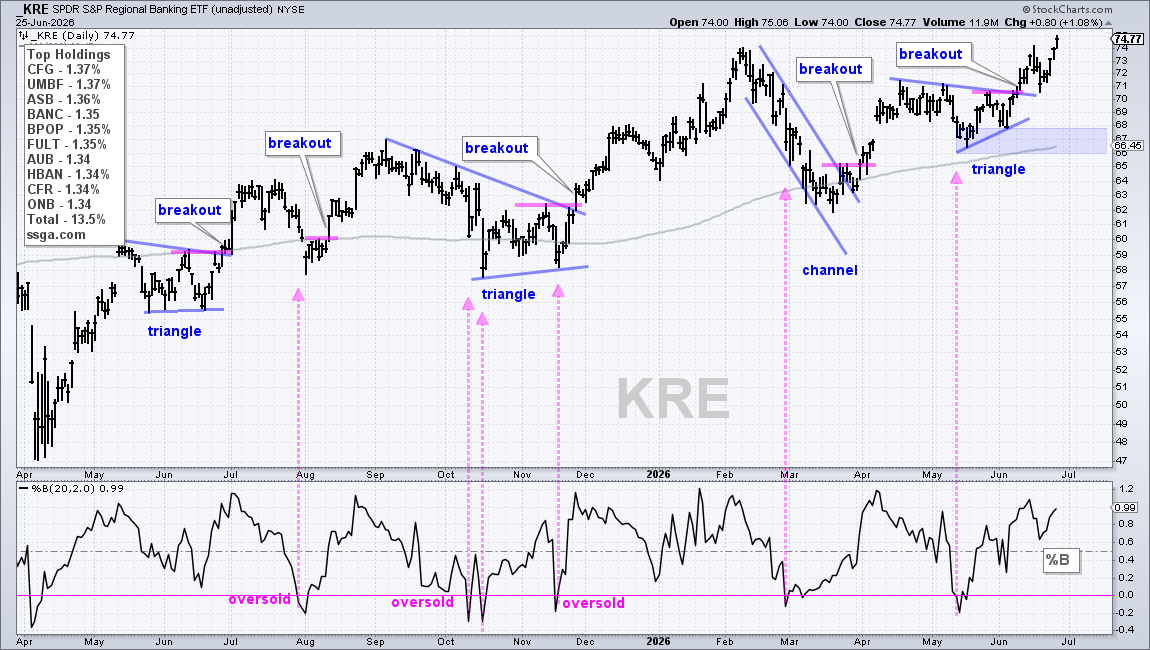
The Regional Bank ETF (KRE) also shows an uptrend, though it slipped below its 200‑day average a few times this year. Since the June 2026 breakout, KRE has made higher highs and higher lows.
When the %B indicator turns oversold, it can signal a pullback that may be bought. The chart shows several short‑term resistance levels where the price paused before moving higher.
Trading pullbacks inside an uptrend lets you build a position while the trend is still strong. The trade stays open until the long‑term trend turns down or a clear bear market appears.
Source: Materials provided by https://articles.stockcharts.com.Note: Content may be edited for style and length.