

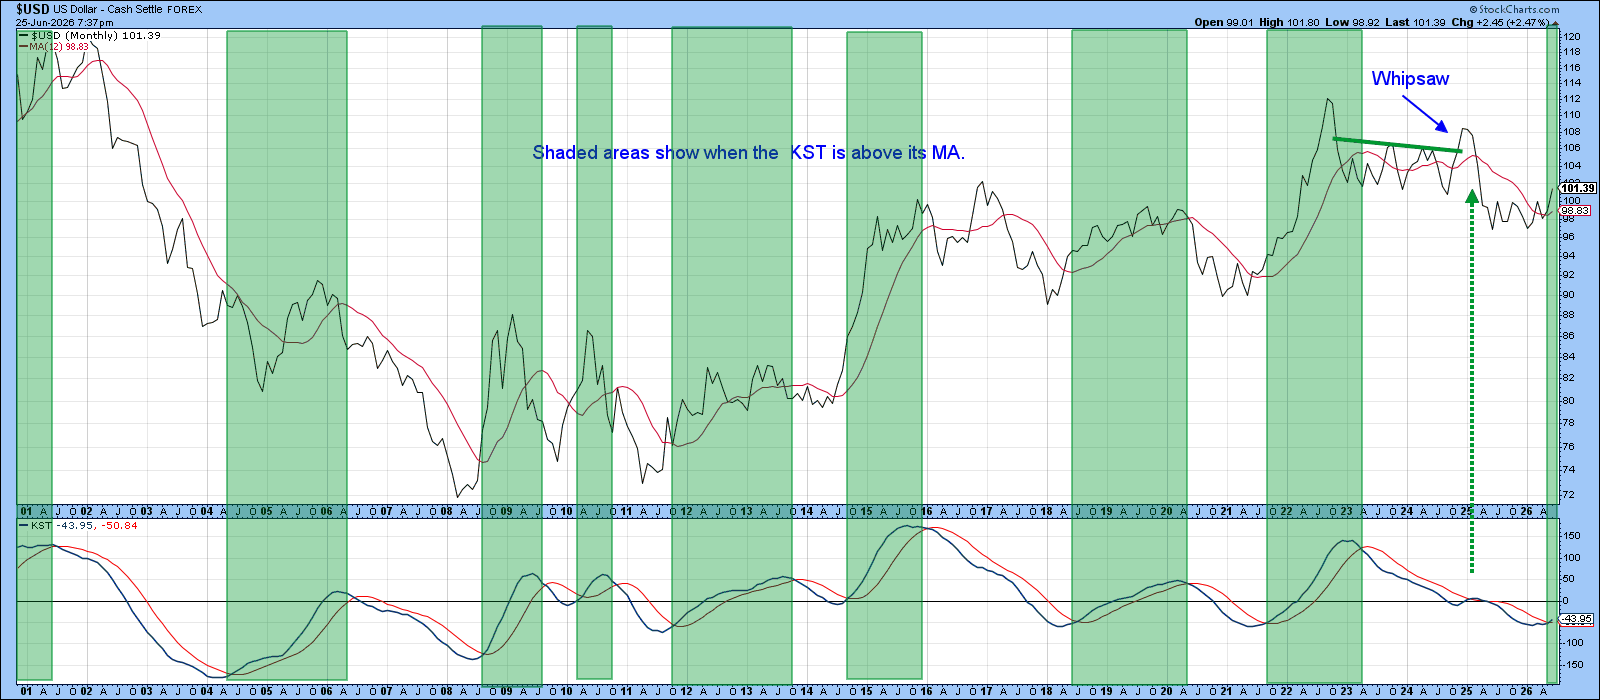
One easy way to see if a market is going up is to check two things: is the price higher than its 12‑month average, and is the long‑term KST line above its own average?
For the U.S. Dollar Index, both of those tests are now green. The price has been over the 12‑month line for a few months, and the KST just crossed above its moving average. When the KST stays above, it usually means the trend is real.
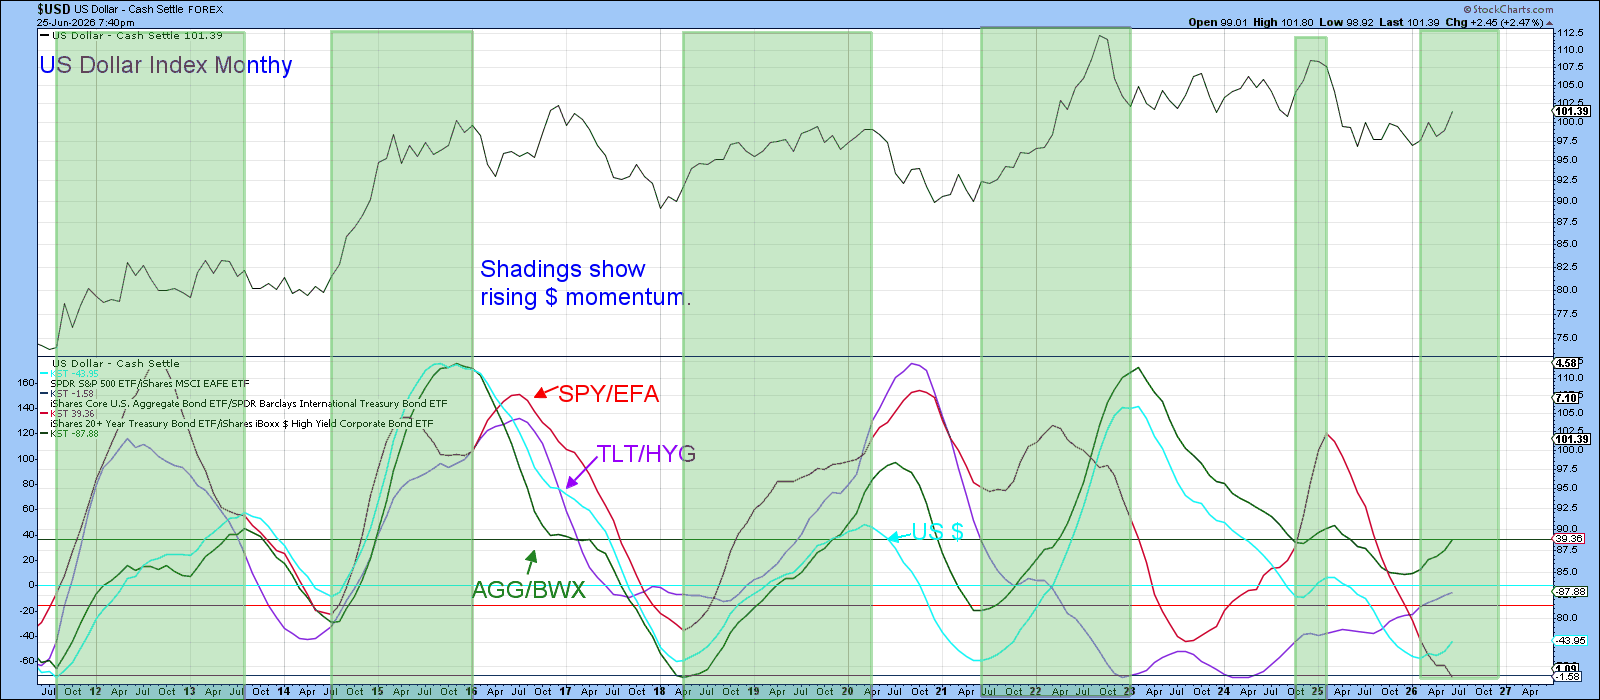
When the dollar starts a new move, it often pulls other markets along. If related pairs move the same way, the signal gets stronger.
In Chart 2 we line up the Dollar Index with three related ratios: the SPY/EFA equity spread, the AGG/BWX bond spread, and the TLT/HYG credit spread. All three are mostly moving with the dollar, except the equity spread, which is still falling.
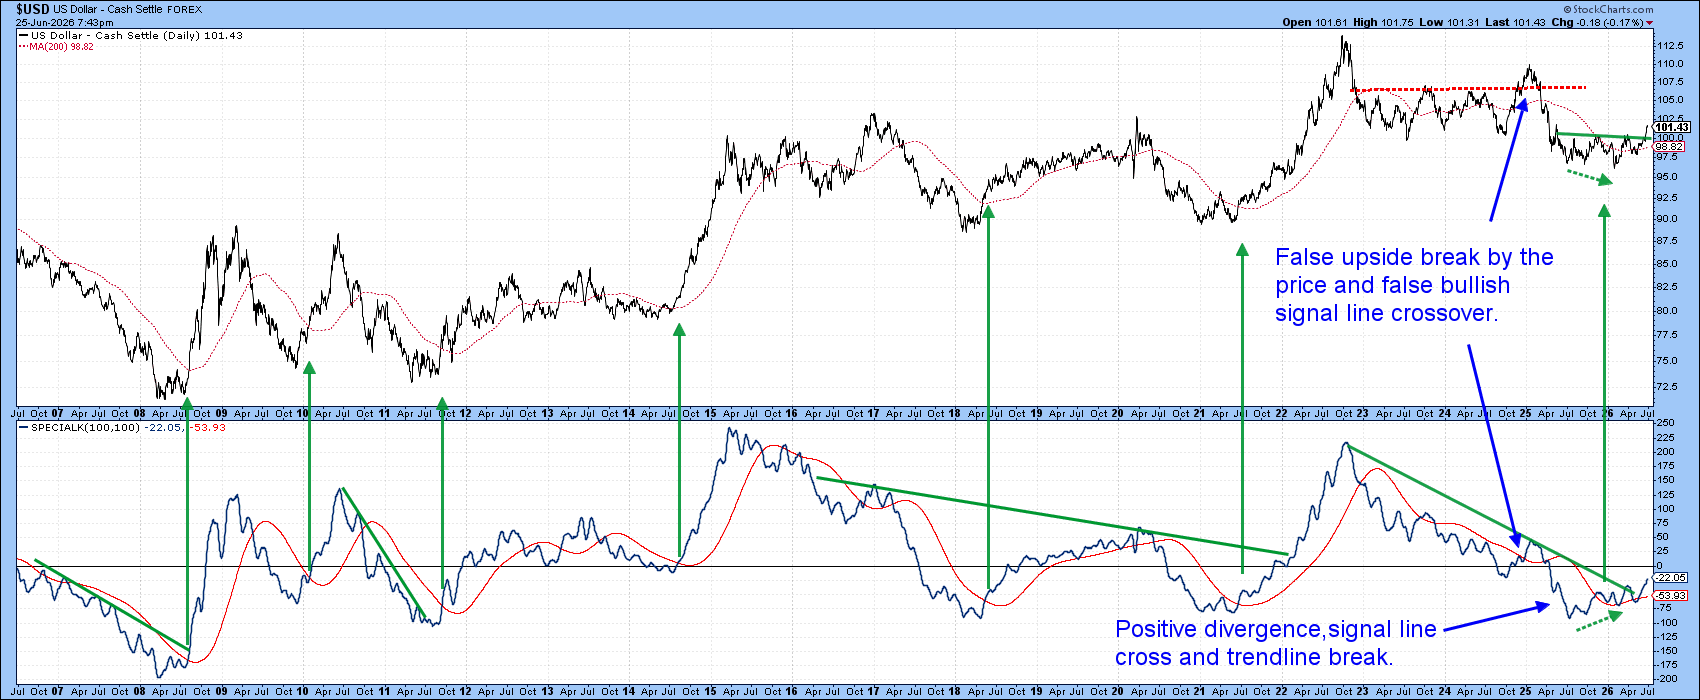
The Special K (SPK) indicator also shows a clear bullish signal when it jumps above its signal line. Earlier this year it did exactly that, and the dollar’s own breakout added extra proof.
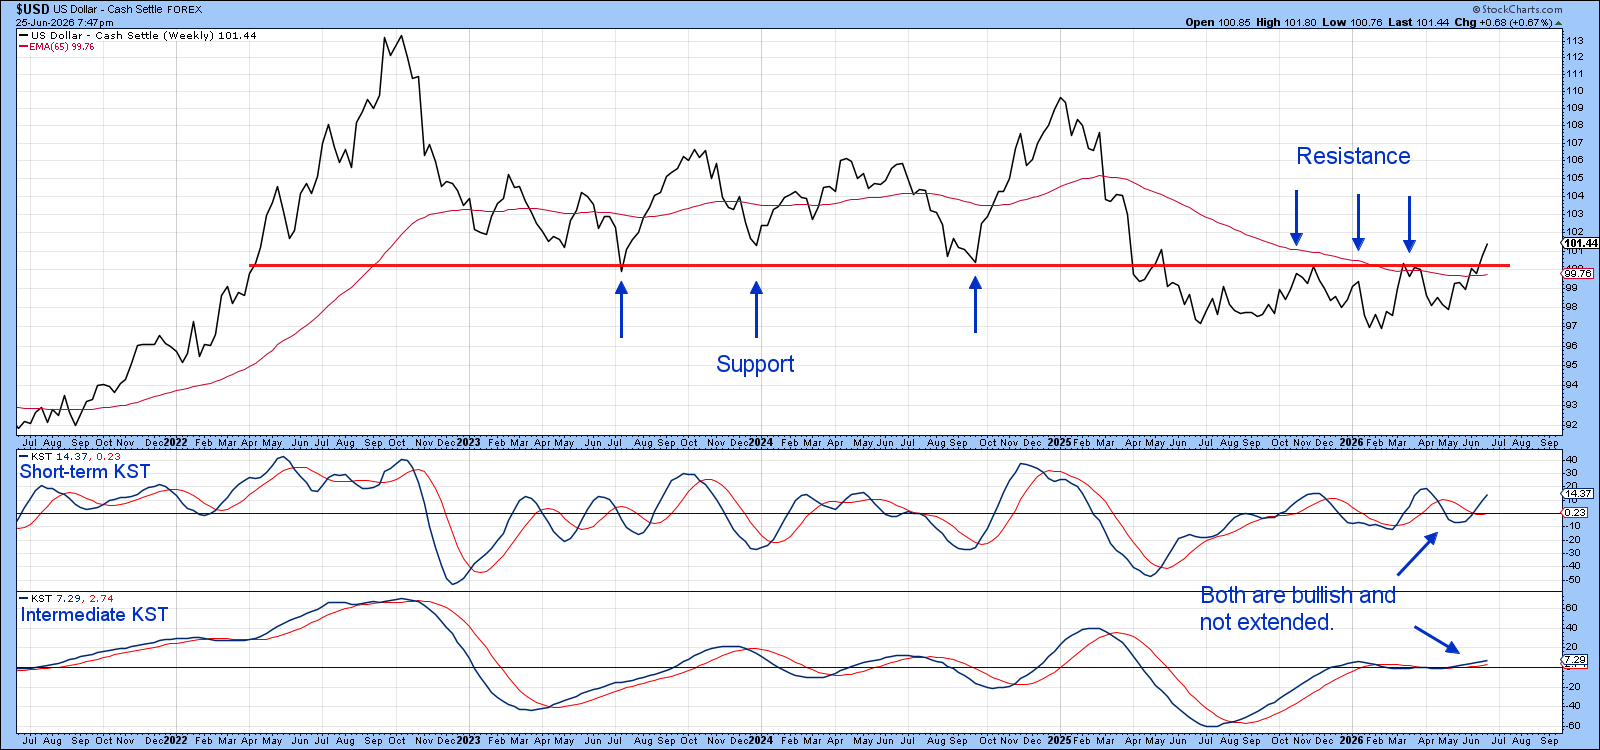
Looking back to 2022, the dollar’s long‑term trend line turned from support into resistance when it was broken. The index is now back above the 65‑week EMA, and both KST lines are positive but not stretched too far.
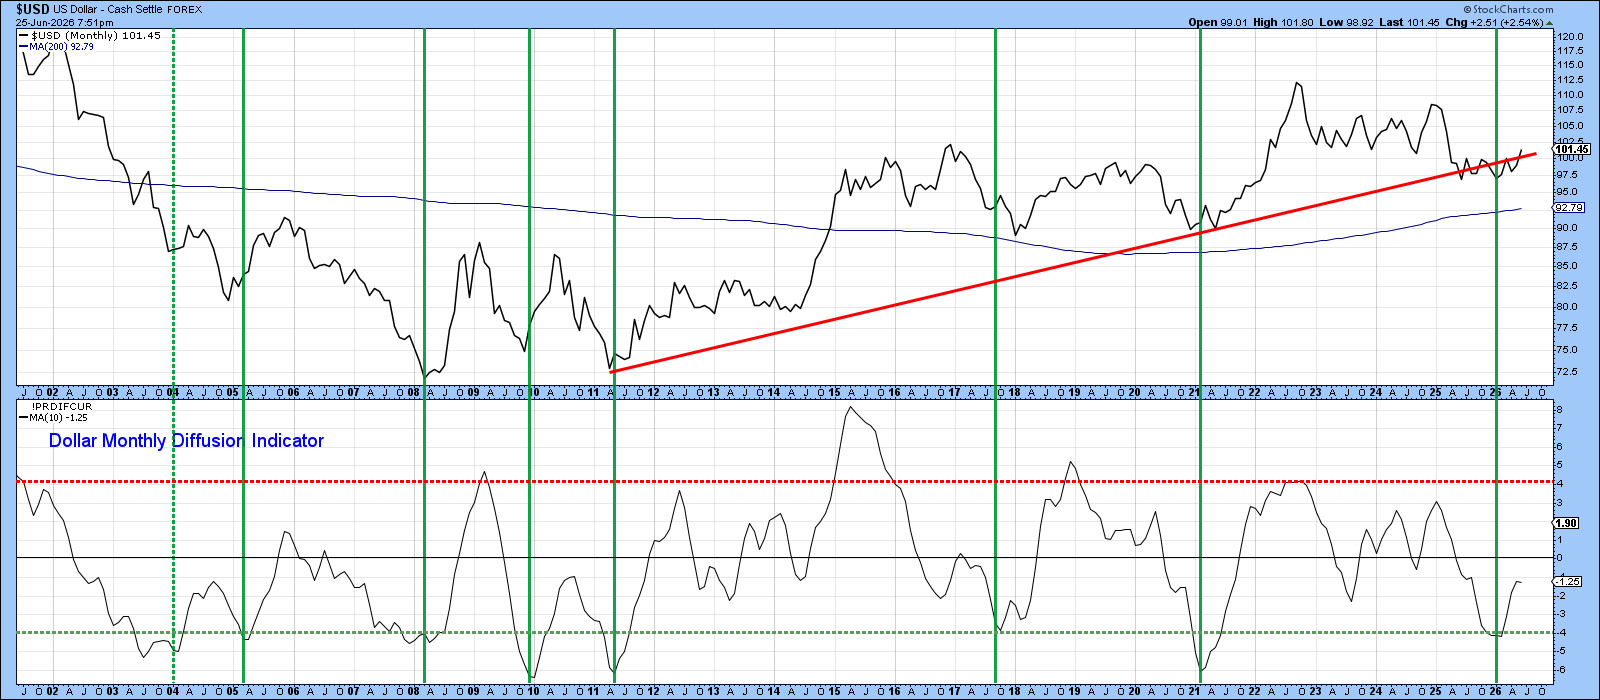
Another view comes from a diffusion oscillator that combines several dollar‑related spreads. The dollar has broken back above its long‑term secular line, and the oscillator is rising from an oversold zone, which historically leads to strong rallies.
Even though many thought the dollar would fall sharply in early 2025, it stayed firm. A short pause may happen, but the long‑term signals all point upward, suggesting the dollar will keep its strength.
Good luck and happy charting!
Source: Materials provided by https://articles.stockcharts.com.Note: Content may be edited for style and length.