

It is jobs week on Wall Street. Payroll numbers are due on Thursday, just before the long holiday. Most economists think the report will be strong, with a good chance of another 100,000‑plus jobs gain. The unemployment rate is expected to stay close to 4.3 %.
Earlier this month the S&P 500 started the week on a positive note. Large‑cap stocks barely slipped after the June Fed meeting, which kept interest rates higher for longer. The Fed chair’s speech, paired with comments from the European Central Bank, gave a lift to bonds.
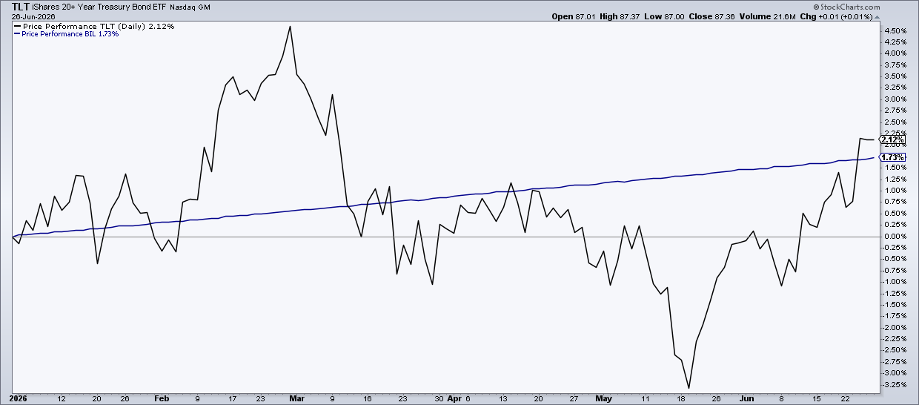
The 30‑year Treasury yield has settled under 5 %. This is a surprise because many analysts thought the yield curve would steepen in 2026. The long‑term Treasury ETF (TLT) has actually outperformed the short‑term Treasury bill ETF (BIL) so far this year.
What lies ahead for the second half of the year? Traders are watching three main themes: market volatility around the mid‑term elections, the direction of long‑term yields, and the path of oil prices.
1. Will the S&P 500 stay steady during the mid‑term election cycle?
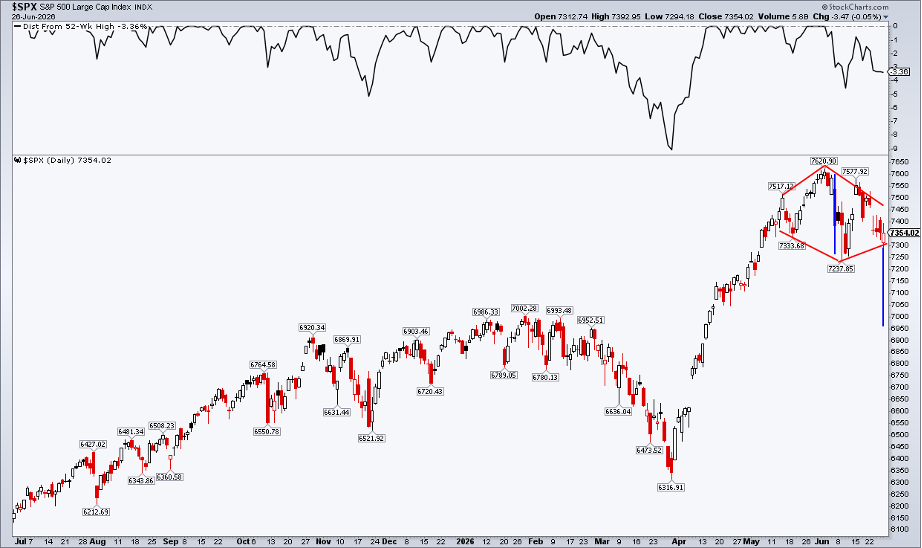
History shows that stocks often wobble before a presidential mid‑term election. The average drop is about 18.5 % and gains are usually modest. So far, the S&P 500 has fallen only 9 % since the start of the year.
Some analysts spot a “diamond‑top” pattern on the chart, which could signal a move lower. If the pattern breaks, the next target might be around 6,950 points, close to the high seen in January‑February.
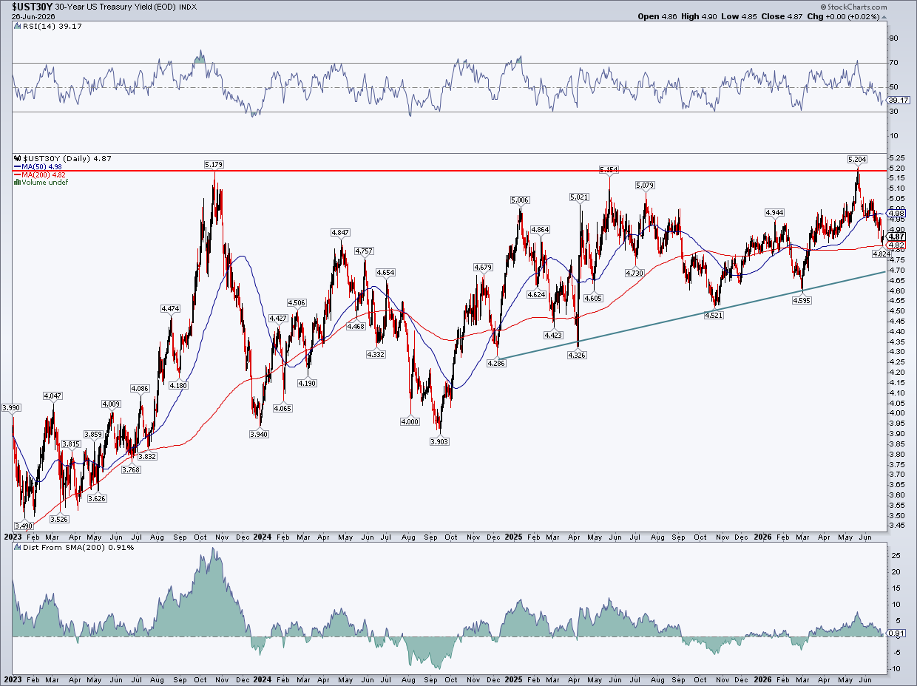
2. Will the 30‑year Treasury rate test 5.15 %–5.20 % again?
The long‑term bond surprised many investors in the second quarter. A relaxed Fed, strong commodity prices and AI‑driven growth helped push rates higher.
Now the 30‑year rate sits near its 200‑day moving average, around 4.70 % support. Resistance sits near 5.15 %–5.20 %. If the rate climbs past that range, a new target of about 6.35 % could be on the table.
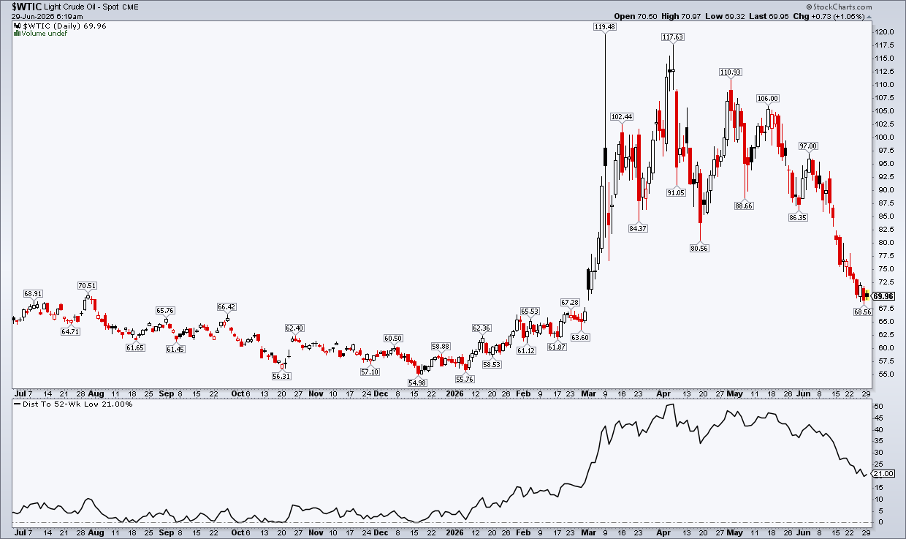
3. What will lower oil prices mean for cyclical stocks?
Crude oil peaked near $120 per barrel in March and April but has since slipped. Even with ongoing tensions in the U.S.–Iran conflict, oil remains about 21 % above its low point from December.
Gasoline futures still trade at a premium to crude, keeping pump prices above $3 per gallon. The shift in the market has favored defensive and value‑oriented stocks, especially health‑care giants like Eli Lilly and Johnson & Johnson.
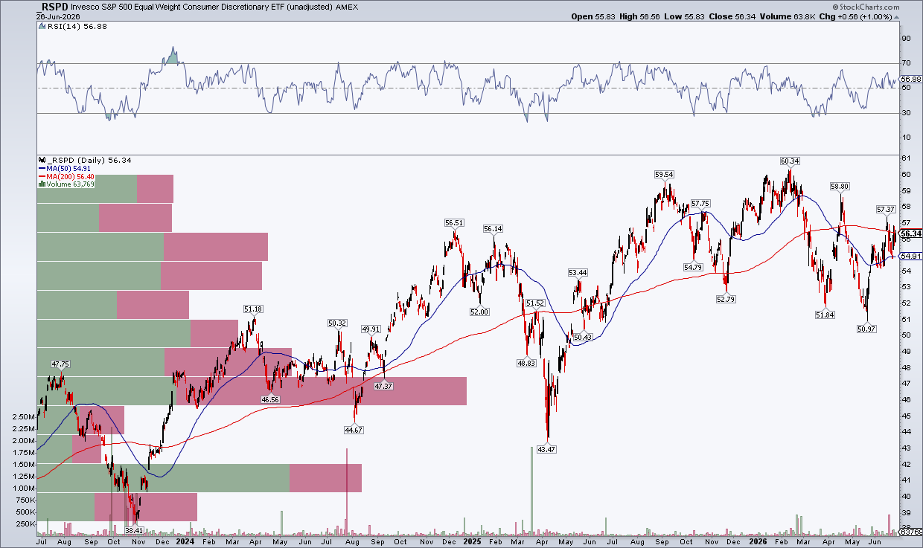
The consumer‑discretionary equal‑weight ETF (RSPD) is about 10 % higher than its late‑May low. A move above $60.34 would be a positive sign, especially as consumer confidence stays weak.
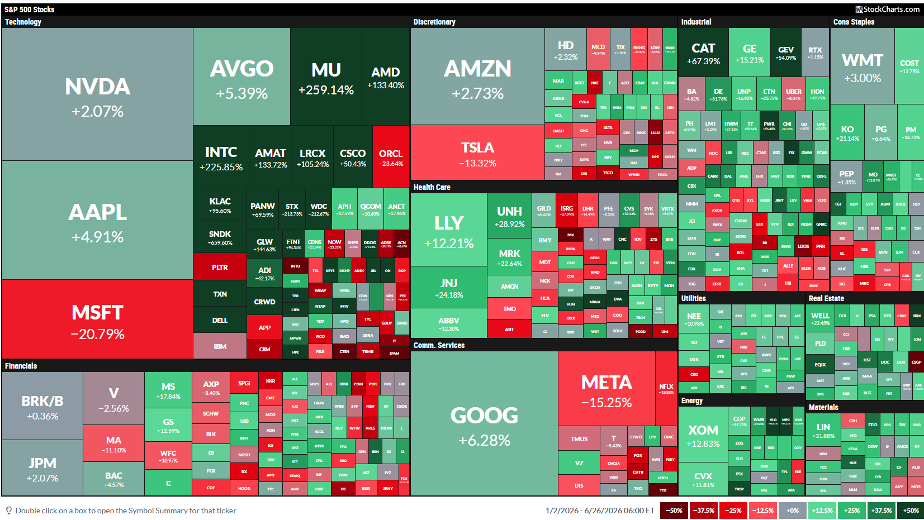
4. Can the “Magnificent Seven” tech giants regain momentum?
The biggest tech names have had mixed results this year. NVIDIA, Apple, Alphabet and Amazon are only slightly higher, while Microsoft, Meta and Tesla have fallen sharply.
Expect continued swings as these stocks move. Watch the Nasdaq‑100 volatility index (VXN); a reading above 30 often signals more turbulence for the tech group.
Bottom Line
Many storylines will shape the market in the second half of 2026. Technical patterns and price trends should guide your view. The near‑term seasonal trend is still bullish through mid‑July, but keep an eye on the four questions above as we move into Q3.
Disclaimer: This article is for educational purposes only and does not constitute financial advice. Always consider your personal financial situation and consult a professional before making investment decisions.
Source: Materials provided by https://articles.stockcharts.com.Note: Content may be edited for style and length.