
Many traders think the S&P 500 is drawing a head‑and‑shoulders top. The shape does not fit well, so forcing it can be misleading.
Dave looks at the real price levels that matter. He marks the big support area around 7,340 and the strong resistance near 7,800. These zones act like safety nets for the market.
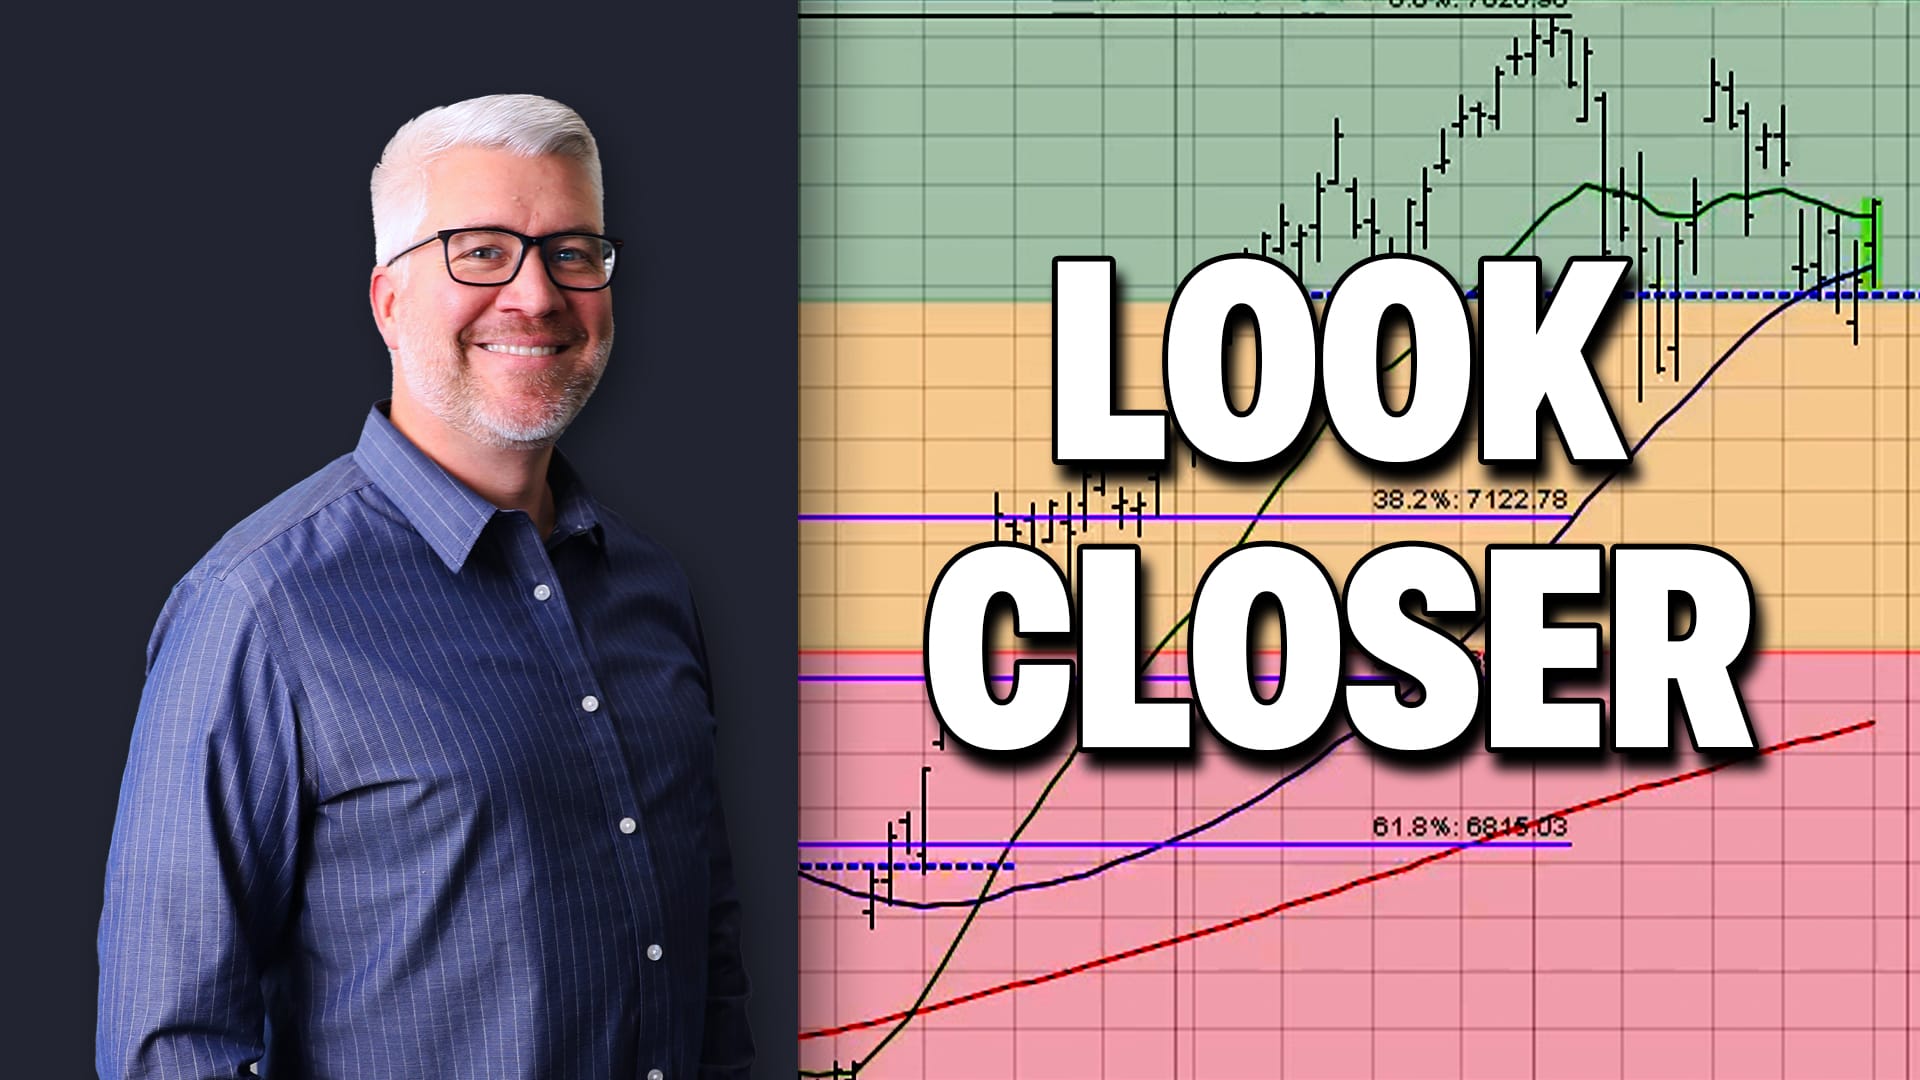
To judge risk, Dave uses a traffic‑light system. Green means the market is healthy, yellow warns of caution, and red signals danger. This simple picture helps investors decide when to stay in or step back.
He also checks the overall trend with his Market Trend Model and market breadth. The advance‑decline line is still making higher highs, showing that buying pressure is strong even if daily moves look choppy.
All three tools – support‑resistance zones, the traffic‑light risk gauge, and breadth indicators – give a clearer view of where the market might go next.
Source: Materials provided by https://articles.stockcharts.com.Note: Content may be edited for style and length.