
The market moved slowly this week, staying inside a tight price band. Nifty swung between 23,784.95 and 24,261.60 and closed near 24,056, only 0.18% higher.
Even though the index is above its recent lows, it still faces a tough barrier. The zone from 24,160 to 24,500 holds both the 100‑day (24,161) and 100‑week (24,504) moving averages, making it a strong wall of resistance. Until Nifty breaks above this band, any bounce will likely be short‑lived.
Next week starts with a market holiday on Friday, so the opening may be cautious. For the index to climb, it must clear the 24,160‑24,500 zone decisively. Immediate resistance sits at 24,160 and 24,500, while support levels are around 23,900 and 23,750. A clear break could spark short‑covering and lift the medium‑term outlook; staying below may keep the market stuck in a broad sideways pattern.
The weekly Relative Strength Index (RSI) reads 48, indicating a neutral stance. The MACD remains bullish, staying above its signal line. The latest weekly candle is a Doji, showing indecision as buyers and sellers battle near the key resistance.
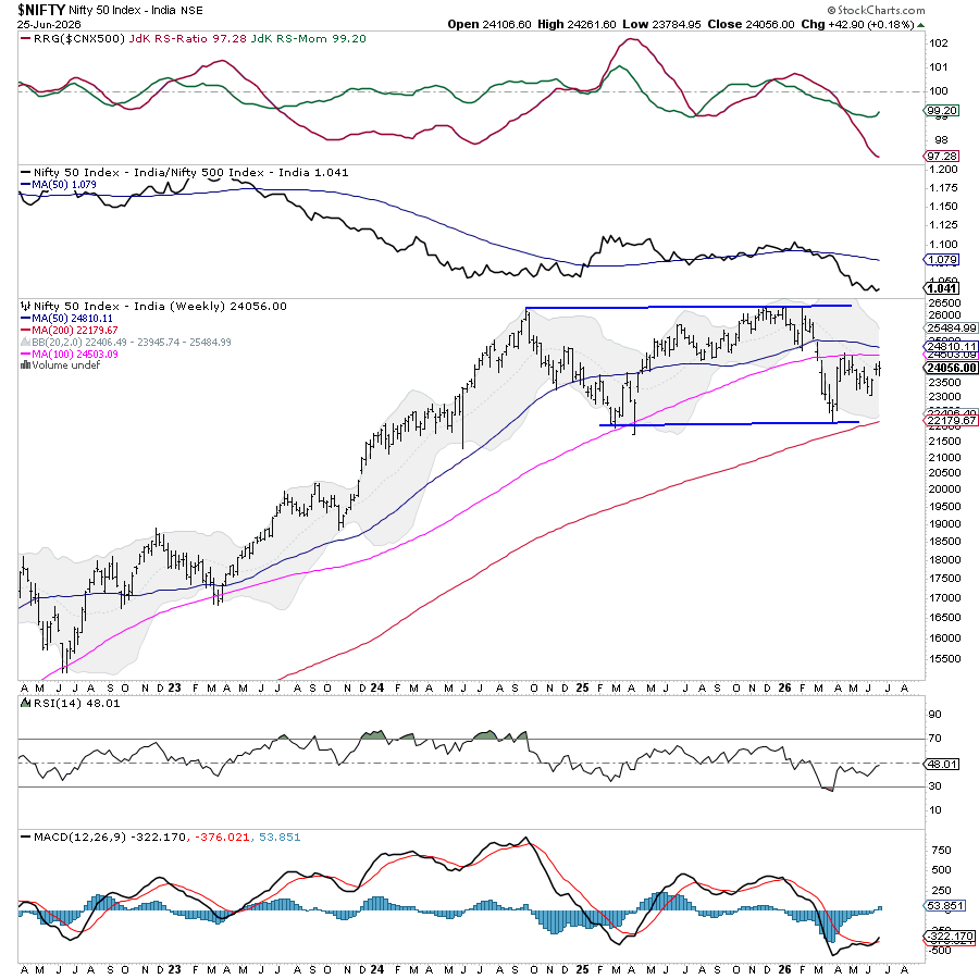
From a pattern view, Nifty is stuck in a wide consolidation after a sharp drop earlier this year. Multiple moving averages crowd the chart, and the index has not reclaimed the 100‑day or 100‑week averages, keeping the short‑term outlook cautious. A firm move above the resistance band would improve the technical picture, while continued rejection would extend the sideways phase.
Overall, risk and reward are balanced. Traders should avoid aggressive buying until a solid breakout occurs. Strong long‑term support suggests staying away from a heavily bearish view. Focus on individual stocks, keep leverage low, and protect capital with tight risk limits.
Sector Outlook for Next Week
Using Relative Rotation Graphs (RRG), we compared major sectors against the Nifty 500 index, which covers most of the market.
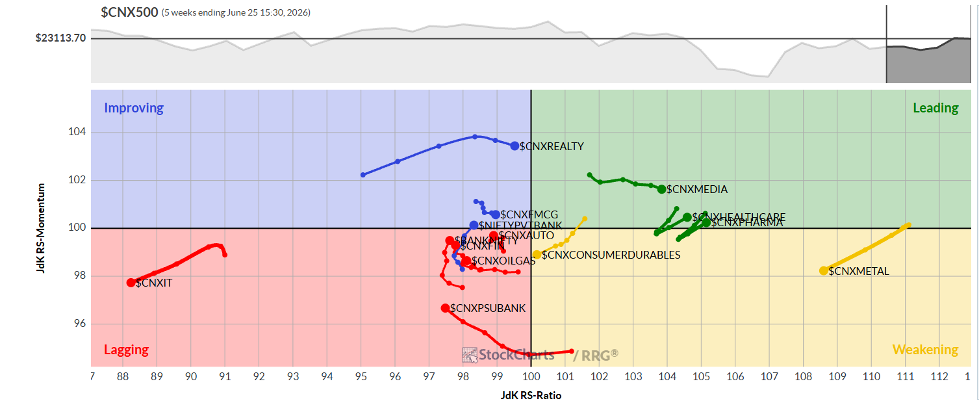
The Pharma, Media and Mid‑Cap 100 indexes have moved into the leading quadrant, indicating they could outperform the broader market.
The Energy, Power, Metal and Infrastructure indexes sit in the weakening quadrant, suggesting slower relative performance.
The IT sector remains in the lagging quadrant, while Services, PSU, Bank, Financial Services and Auto indexes are also lagging but showing signs of improvement.
FMCG and Realty are in the improving quadrant, though FMCG’s momentum is fading compared with the market.
Note: RRG charts show relative strength and momentum. They are for insight only and should not be taken as direct buy or sell signals.
Source: Materials provided by https://articles.stockcharts.com.Note: Content may be edited for style and length.