

Finding Hidden Stock Gems with Simple Breakout and SCTR Scan
I like to invest in stocks that are moving up faster than most. My job is to find these strong moves and stay with them while the trend stays healthy.
Sometimes I am asked if I ever look at weaker‑scoring stocks. The StockCharts Technical Ranking (SCTR) rates how strong a stock’s momentum is. A high SCTR means strong momentum; a low SCTR means weaker momentum.
By mixing a three‑month breakout scan with a low‑SCTR filter, I can catch stocks that are just starting their up‑trend. Below is a simple scan you can copy into the StockCharts scan engine.
type = stock
and (exchange = NYSE or exchange = NASD)
and group is not ETF
and market cap > 5000
and Weekly Close > Last Week's MAX(13,Close)
and SCTR < 50
The last two lines are the key. They look for stocks whose weekly close is higher than any close in the past 13 weeks – a new three‑month high. The SCTR < 50 rule removes stocks that are already in a strong, long‑running uptrend.

Why the Low SCTR Filter Helps
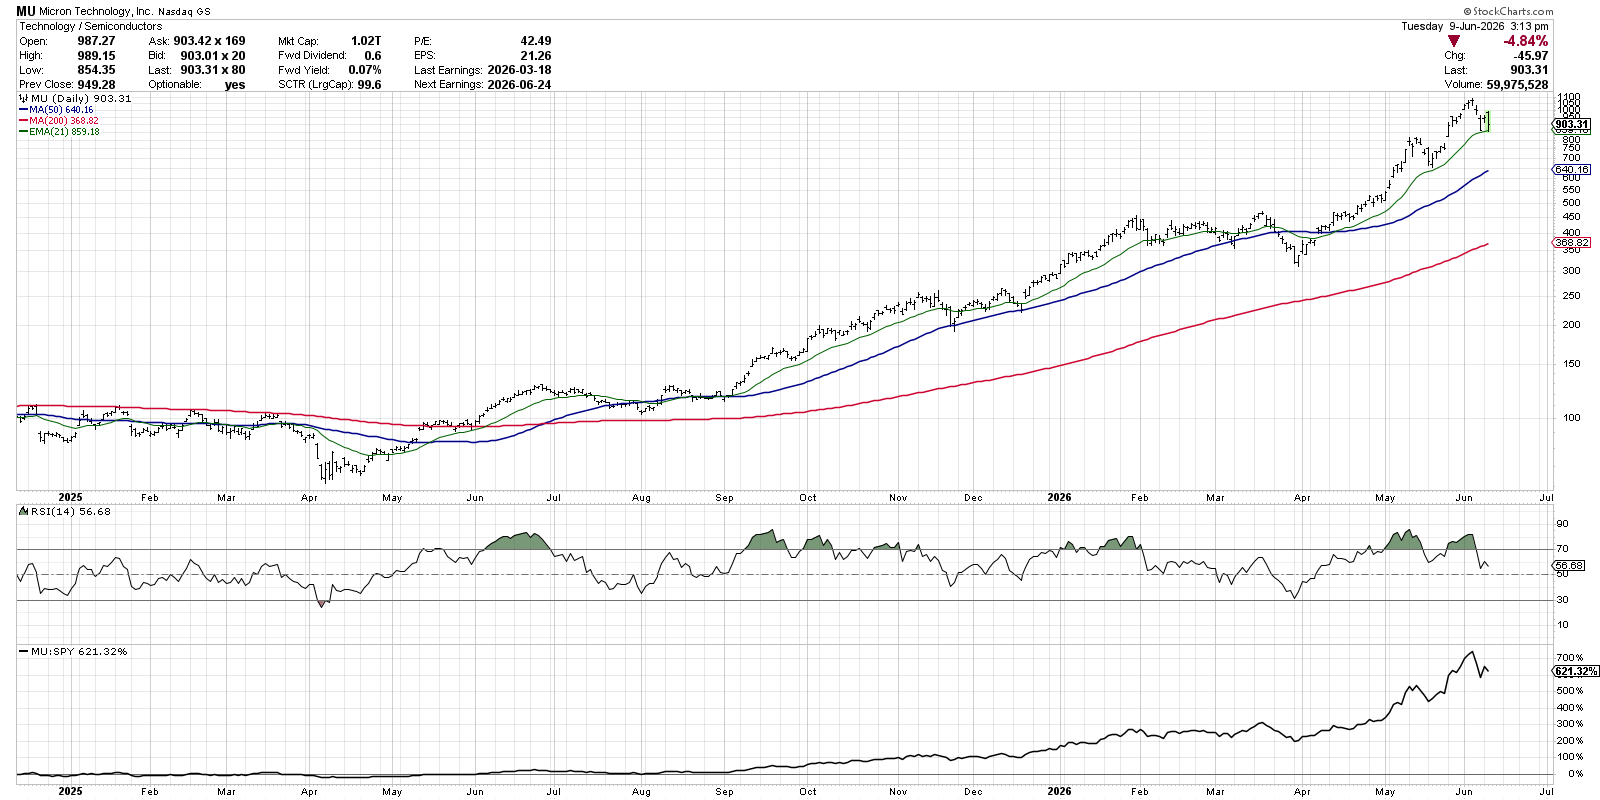
Without the SCTR filter, a basic "new 13‑week high" scan would give you big names that have been rising for months, like Micron (MU). Those stocks are already well known and often overbought.
Adding SCTR < 50 narrows the list to stocks that are still early in their accumulation phase. They may be less popular, but they can offer big upside.
Example: Fox Corporation (FOX)
Fox recently showed up in the scan with an SCTR of about 49. The stock is still recovering from a sharp drop earlier this year. Over the last three months it has made higher highs and higher lows, and it broke back above its 200‑day moving average in April.
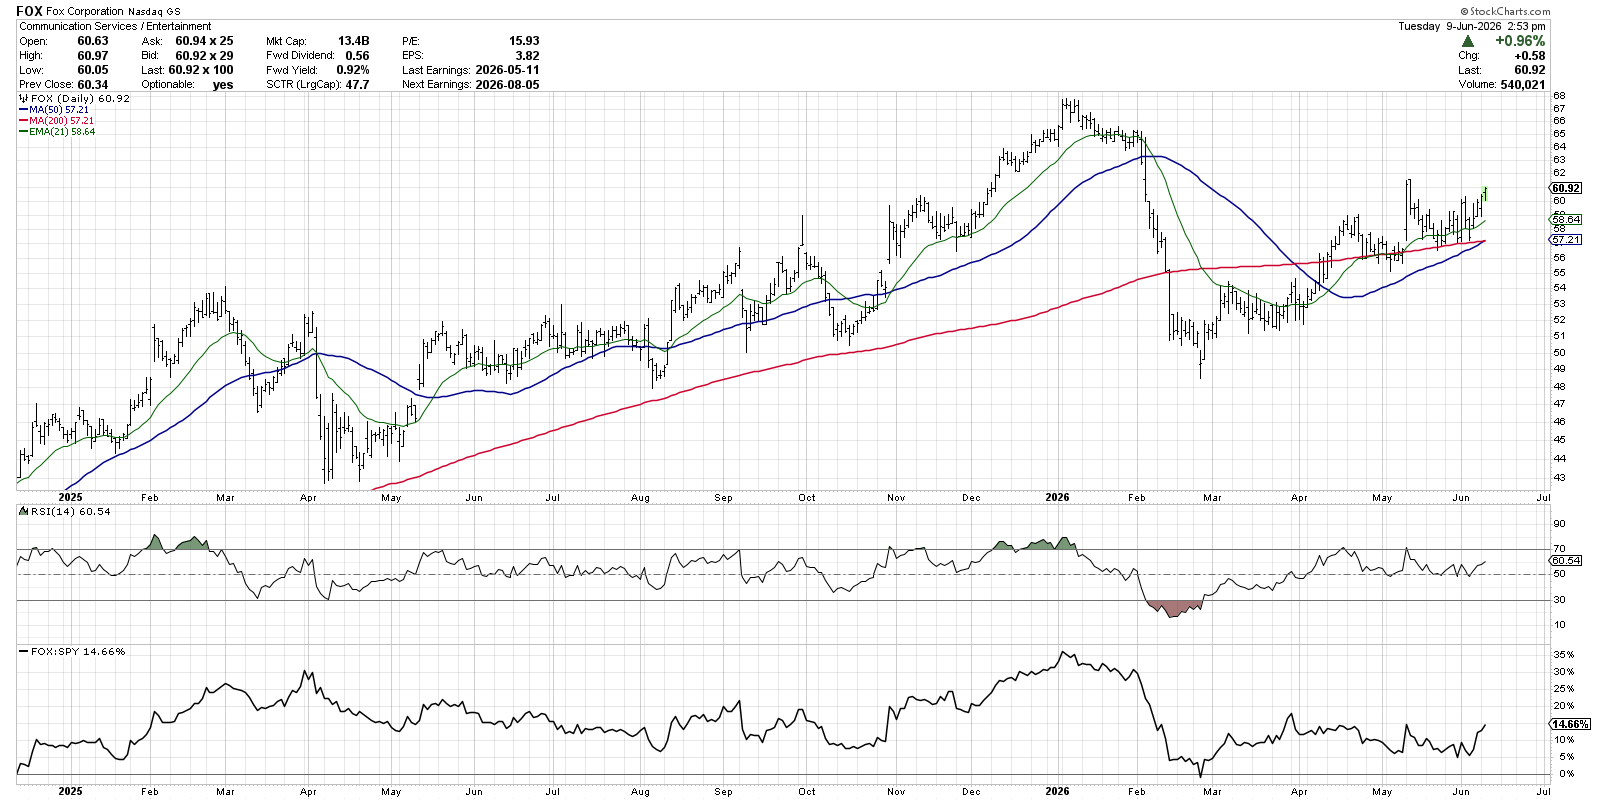
When watching a chart like this, I look for two things:
- Each pull‑back must create a new higher low.
- The RSI should stay above the 40‑50 zone to confirm momentum.
Example: Iqvia Holdings (IQV)
Iqvia appeared in the scan as the only health‑care name. Its pattern mirrors Fox’s higher‑highs‑higher‑lows shape, but it is still below the 200‑day moving average.
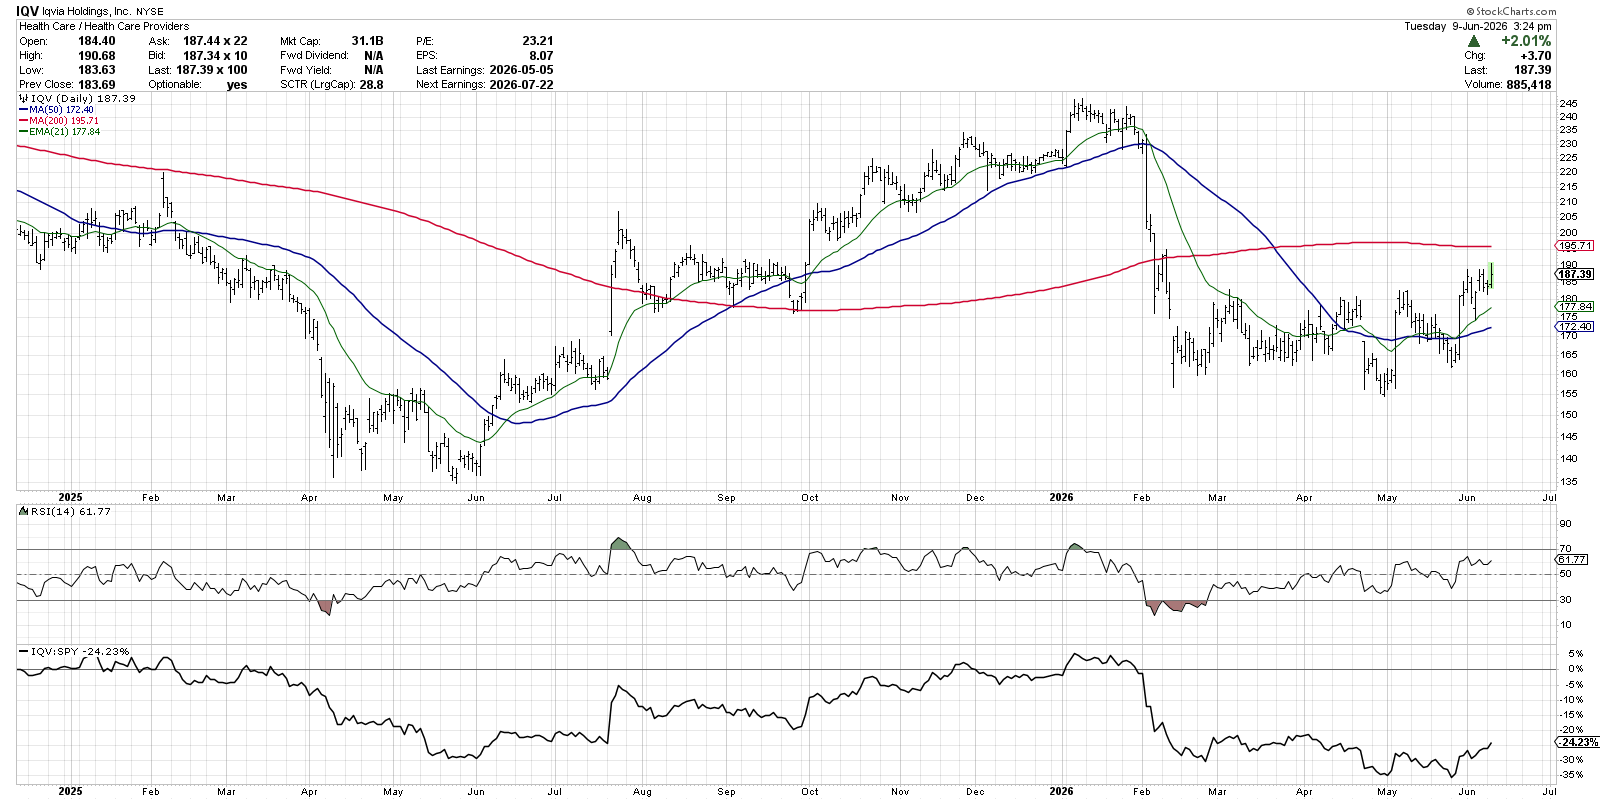
For IQV, the breakout above $180 was an early sign of a new accumulation phase. If the price can push above the 200‑day line and the RSI climbs past 60, the stock could become a leader in a longer‑term uptrend.
Why This Scan Is Useful
Many investors are tired of very expensive tech names that are already stretched. This scan points to value‑oriented and defensive stocks that may be ready to start a fresh move.
Running the scan regularly can help you spot the next "good chart" before it gets too popular.
Remember: good charts are built on higher highs, higher lows, and steady momentum. Keep an eye on those patterns and you may find hidden gems early.
Disclaimer: This material is for educational purposes only. It is not financial advice. Always consider your own situation or consult a professional before investing.
Source: Materials provided by https://articles.stockcharts.com.Note: Content may be edited for style and length.